Bitcoin Macro Trend Map [Ox_kali]
## Introduction
__________________________________________________________________________________
The “Bitcoin Macro Trend Map” script is designed to provide a comprehensive analysis of Bitcoin’s macroeconomic trends. By leveraging a unique combination of Bitcoin-specific macroeconomic indicators, this script helps traders identify potential market peaks and troughs with greater accuracy. It synthesizes data from multiple sources to offer a probabilistic view of market excesses, whether overbought or oversold conditions.
This script offers significant value for the following reasons:
1. Holistic Market Analysis : It integrates a diverse set of indicators that cover various aspects of the Bitcoin market, from investor sentiment and market liquidity to mining profitability and network health. This multi-faceted approach provides a more complete picture of the market than relying on a single indicator.
2. Customization and Flexibility : Users can customize the script to suit their specific trading strategies and preferences. The script offers configurable parameters for each indicator, allowing traders to adjust settings based on their analysis needs.
3. Visual Clarity : The script plots all indicators on a single chart with clear visual cues. This includes color-coded indicators and background changes based on market conditions, making it easy for traders to quickly interpret complex data.
4. Proven Indicators : The script utilizes well-established indicators like the EMA, NUPL, PUELL Multiple, and Hash Ribbons, which are widely recognized in the trading community for their effectiveness in predicting market movements.
5. A New Comprehensive Indicator : By integrating background color changes based on the aggregate signals of various indicators, this script essentially creates a new, comprehensive indicator tailored specifically for Bitcoin. This visual representation provides an immediate overview of market conditions, enhancing the ability to spot potential market reversals.
Optimal for use on timeframes ranging from 1 day to 1 week , the “Bitcoin Macro Trend Map” provides traders with actionable insights, enhancing their ability to make informed decisions in the highly volatile Bitcoin market. By combining these indicators, the script delivers a robust tool for identifying market extremes and potential reversal points.
## Key Indicators
__________________________________________________________________________________
Macroeconomic Data: The script combines several relevant macroeconomic indicators for Bitcoin, such as the 10-month EMA, M2 money supply, CVDD, Pi Cycle, NUPL, PUELL, MRVR Z-Scores, and Hash Ribbons (Full description bellow).
Open Source Sources: Most of the scripts used are sourced from open-source projects that I have modified to meet the specific needs of this script.
Recommended Timeframes: For optimal performance, it is recommended to use this script on timeframes ranging from 1 day to 1 week.
Objective: The primary goal is to provide a probabilistic solution to identify market excesses, whether overbought or oversold points.
## Originality and Purpose
__________________________________________________________________________________
This script stands out by integrating multiple macroeconomic indicators into a single comprehensive tool. Each indicator is carefully selected and customized to provide insights into different aspects of the Bitcoin market. By combining these indicators, the script offers a holistic view of market conditions, helping traders identify potential tops and bottoms with greater accuracy. This is the first version of the script, and additional macroeconomic indicators will be added in the future based on user feedback and other inputs.
## How It Works
__________________________________________________________________________________
The script works by plotting each macroeconomic indicator on a single chart, allowing users to visualize and interpret the data easily. Here’s a detailed look at how each indicator contributes to the analysis:
EMA 10 Monthly: Uses an exponential moving average over 10 monthly periods to signal bullish and bearish trends. This indicator helps identify long-term trends in the Bitcoin market by smoothing out price fluctuations to reveal the underlying trend direction.Moving Averages w/ 18 day/week/month.
Credit to @ryanman0
M2 Money Supply: Analyzes the evolution of global money supply, indicating market liquidity conditions. This indicator tracks the changes in the total amount of money available in the economy, which can impact Bitcoin’s value as a hedge against inflation or economic instability.
Credit to @dylanleclair
CVDD (Cumulative Value Days Destroyed): An indicator based on the cumulative value of days destroyed, useful for identifying market turning points. This metric helps assess the Bitcoin market’s health by evaluating the age and value of coins that are moved, indicating potential shifts in market sentiment.
Credit to @Da_Prof
Pi Cycle: Uses simple and exponential moving averages to detect potential sell points. This indicator aims to identify cyclical peaks in Bitcoin’s price, providing signals for potential market tops.
Credit to @NoCreditsLeft
NUPL (Net Unrealized Profit/Loss): Measures investors’ unrealized profit or loss to signal extreme market levels. This indicator shows the net profit or loss of Bitcoin holders as a percentage of the market cap, helping to identify periods of significant market optimism or pessimism.
Credit to @Da_Prof
PUELL Multiple: Assesses mining profitability relative to historical averages to indicate buying or selling opportunities. This indicator compares the daily issuance value of Bitcoin to its yearly average, providing insights into when the market is overbought or oversold based on miner behavior.
Credit to @Da_Prof
MRVR Z-Scores: Compares market value to realized value to identify overbought or oversold conditions. This metric helps gauge the overall market sentiment by comparing Bitcoin’s market value to its realized value, identifying potential reversal points.
Credit to @Pinnacle_Investor
Hash Ribbons: Uses hash rate variations to signal buying opportunities based on miner capitulation and recovery. This indicator tracks the health of the Bitcoin network by analyzing hash rate trends, helping to identify periods of miner capitulation and subsequent recoveries as potential buying opportunities.
Credit to @ROBO_Trading
## Indicator Visualization and Interpretation
__________________________________________________________________________________
For each horizontal line representing an indicator, a legend is displayed on the right side of the chart. If the conditions are positive for an indicator, it will turn green, indicating the end of a bearish trend. Conversely, if the conditions are negative, the indicator will turn red, signaling the end of a bullish trend.
The background color of the chart changes based on the average of green or red indicators. This parameter is configurable, allowing adjustment of the threshold at which the background color changes, providing a clear visual indication of overall market conditions.
## Script Parameters
__________________________________________________________________________________
The script includes several configurable parameters to customize the display and behavior of the indicators:
Color Style:
Normal: Default colors.
Modern: Modern color style.
Monochrome: Monochrome style.
User: User-customized colors.
Custom color settings for up trends (Up Trend Color), down trends (Down Trend Color), and NaN (NaN Color)
Background Color Thresholds:
Thresholds: Settings to define the thresholds for background color change.
Low/High Red Threshold: Low and high thresholds for bearish trends.
Low/High Green Threshold: Low and high thresholds for bullish trends.
Indicator Display:
Options to show or hide specific indicators such as EMA 10 Monthly, CVDD, Pi Cycle, M2 Money, NUPL, PUELL, MRVR Z-Scores, and Hash Ribbons.
Specific Indicator Settings:
EMA 10 Monthly: Options to customize the period for the exponential moving average calculation.
M2 Money: Aggregation of global money supply data.
CVDD: Adjustments for value normalization.
Pi Cycle: Settings for simple and exponential moving averages.
NUPL: Thresholds for unrealized profit/loss values.
PUELL: Adjustments for mining profitability multiples.
MRVR Z-Scores: Settings for overbought/oversold values.
Hash Ribbons: Options for hash rate moving averages and capitulation/recovery signals.
## Conclusion
__________________________________________________________________________________
The “Bitcoin Macro Trend Map” by Ox_kali is a tool designed to analyze the Bitcoin market. By combining several macroeconomic indicators, this script helps identify market peaks and troughs. It is recommended to use it on timeframes from 1 day to 1 week for optimal trend analysis. The scripts used are sourced from open-source projects, modified to suit the specific needs of this analysis.
## Notes
__________________________________________________________________________________
This is the first version of the script and it is still in development. More indicators will likely be added in the future. Feedback and comments are welcome to improve this tool.
## Disclaimer:
__________________________________________________________________________________
Please note that the Open Interest liquidation map is not a guarantee of future market performance and should be used in conjunction with proper risk management. Always ensure that you have a thorough understanding of the indicator’s methodology and its limitations before making any investment decisions. Additionally, past performance is not indicative of future results.
Buscar en scripts para "the script"

Volume Profile with Node Detection [LuxAlgo]The Volume Profile with Node Detection is a charting tool that allows visualizing the distribution of traded volume across specific price levels and highlights significant volume nodes or clusters of volume nodes that traders may find relevant in utilizing in their trading strategies.
🔶 USAGE
The volume profile component of the script serves as the foundation for node detection while encompassing all the essential features expected from a volume profile. See the sub-sections below for more detailed information about the indicator components and their usage.
🔹 Peak Volume Node Detection
A volume peak node is identified when the volume profile nodes for the N preceding and N succeeding nodes are lower than that of the evaluated one.
Displaying peak volume nodes along with their surrounding N nodes (Zones or Clusters) helps visualize the range, typically representing consolidation zones in the market. This feature enables traders to identify areas where trading activity has intensified, potentially signaling periods of price consolidation or indecision among market participants.
🔹 Trough Volume Node Detection
A volume trough node is identified when the volume profile nodes for the N preceding and N succeeding nodes are higher than that of the evaluated one.
🔹 Highest and Lowest Volume Nodes
Both the highest and lowest volume areas play significant roles in trading. The highest volume areas typically represent zones of strong price acceptance, where a significant amount of trading activity has occurred. On the other hand, the lowest volume areas signify price levels with minimal trading activity, often indicating zones of price rejection or areas where market participants have shown less interest.
🔹 Volume profile
Volume profile is calculated based on the volume of trades that occur at various price levels within a specified timeframe. It divides the price range into discrete price intervals, typically known as "price buckets" or "price bars," and then calculates the total volume of trades that occur at each price level within those intervals. This information is then presented graphically as a histogram or profile, where the height of each bar represents the volume of trades that occurred at that particular price level.
🔶 SETTINGS
🔹 Volume Nodes
Volume Peaks: Toggles the visibility of either the "Peaks" or "Clusters" on the chart, depending on the specified percentage for detection.
Node Detection Percent %: Specifies the percentage for the Volume Peaks calculation.
Volume Troughs: Toggles the visibility of either the "Troughs" or "Clusters" on the chart, depending on the specified percentage for detection.
Node Detection Percent %: Specifies the percentage for the Volume Troughs calculation.
Volume Node Threshold %: A threshold value specified as a percentage is utilized to detect peak/trough volume nodes. If a value is set, the detection will disregard volume node values lower than the specified threshold.
Highest Volume Nodes: Toggles the visibility of the highest nodes for the specified count.
Lowest Volume Nodes: Toggles the visibility of the lowest nodes for the specified count.
🔹 Volume Profile - Components
Volume Profile: Toggles the visibility of the volume profile with either classical display or gradient display.
Value Area Up / Down: Color customization option for the volume nodes within the value area of the profile.
Profile Up / Down Volume: Color customization option for the volume nodes outside of the value area of the profile.
Point of Control: Toggles the visibility of the point of control, allowing selection between "developing" or "regular" modes. Sets the color and width of the point of control line accordingly.
Value Area High (VAH): Toggles the visibility of the value area high level and allows customization of the line color.
Value Area Low (VAL): Toggles the visibility of the value area low level and allows customization of the line color.
Profile Price Labels: Toggles the visibility of the Profile Price Levels and allows customization of the text size of the levels.
🔹 Volume Profile - Display Settings
Profile Lookback Length: Specifies the length of the profile lookback period.
Value Area (%): Specifies the percentage for calculating the value area.
Profile Placement: Specify where to display the profile.
Profile Number of Rows: Specify the number of rows the profile will have.
Profile Width %: Adjusts the width of the rows in the profile relative to the profile range.
Profile Horizontal Offset: Adjusts the horizontal offset of the profile when it is selected to be displayed on the right side of the chart.
Value Area Background: Toggles the visibility of the value area background and allows customization of the fill color.
Profile Background: Toggles the visibility of the profile background and allows customization of the fill color.
🔶 RELATED SCRIPTS
Supply-Demand-Profiles
Liquidity-Sentiment-Profile
Thanks to our community for recommending this script. For more conceptual scripts and related content, we welcome you to explore by visiting >>> LuxAlgo-Scripts .

High Volume AlertThe High Volume Alert Script is developed for all traders focusing on volume analysis in their trading strategies, providing alerts for unusually high trading volumes during specified trading sessions.
Functionality:
Volume Moving Average Calculation:
Average Volume = Moving Average(Volume) = Sum of last the x last candles Volume
Where n is the user-defined period for the moving average calculation (denoted as movingaverageinput in the script. This moving average serves as the baseline to compare current volume levels against historical averages.
High Volume Detection:
HighVolume = CurrentVolume >= (MA(Volume) x HighVolumeRatio)
Here, HighVolumeRatio is a user-defined multiplier that sets the threshold for what is considered high volume. If the current volume exceeds this threshold (the product of the moving average of volume and the HighVolumeRatio ), the script identifies this as a high-volume event.
Session Filtering:
The script further refines these alerts by ensuring they only trigger during the specified trading session, enhancing relevance for traders interested in specific market hours. This session is defined by the sess and timezone parameters.
Visualisation and Alerts:
If high volume is detected (HighVolume = True), the script colors the volume bar with the highVolumeColor . If the option is selected, it also changes the color of the candlestick to either highVolumeCandleColorUp (for bullish candles) or highVolumeCandleColorDown (for bearish candles), depending on the price movement within the high-volume period. An alert is generated through the alertcondition function when high volume is detected during the specified session, notifying the trader of potentially significant market activity.
Application in Trading:
This indicator serves traders who prioritize volume as a leading indicator of potential price movement. High trading volumes may indicate the presence of significant market activity, often associated with events like news releases, market openings, or large trades, which can precede price movements.
Originality and Practicality:
This script is self-developed, aiming to fill the gap in automatic ratio adjusted volume alerts within the TradingView environment.
Conclusion:
The High Volume Alert Script is an essential tool for traders who integrate volume analysis into their strategy, offering tailored alerts and visual cues for high volume periods.
Compliance and Limitations:
The script complies with TradingView scripting standards, ensuring no lookahead bias and maintaining real-time data integrity. However, its utility depends on the availability on volume data, and please be aware that forex pairs never offer real volume data, this tool is best used with a exchange traded symbol.
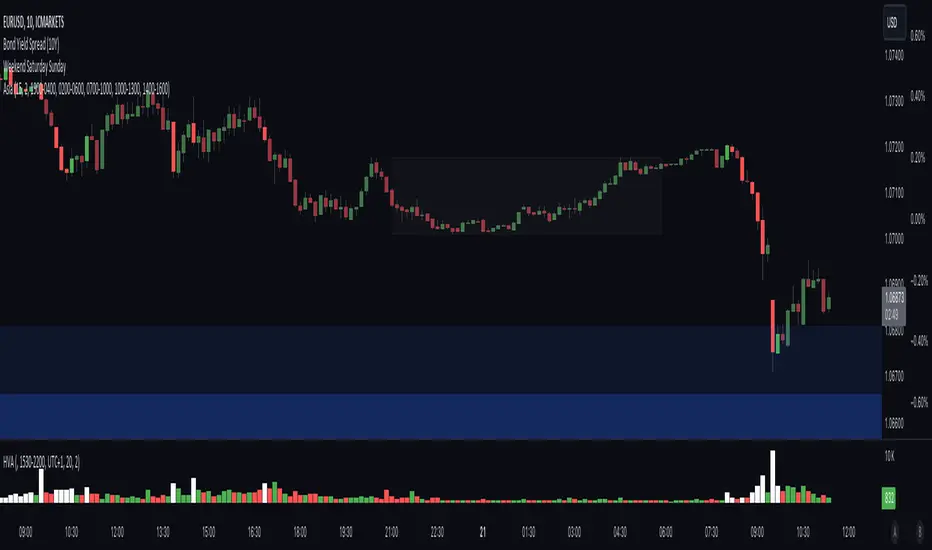
Bond Yield SpreadThe Bond Yield Spread Script is developed for forex traders, offering an automated tool to calculate the bond yield spread between two countries associated with the forex pair displayed on the chart.
Functionality:
The script starts by identifying the base and quote currencies of the current forex pair and aligns them with their corresponding national bond symbols based on user-selected maturity, with options ranging from 01Y to 30Y. It calculates the yield spread by subtracting the bond yield associated with the quote country from that of the base country, following the formula:
Yield Spread = Yield(Base Country) − Yield(Quote Country)
which is then displayed as a plot line on the chart.
This script relies solely on TradingView's internal yield symbols, with the following calculation:
"currency" => "first two letters" + maturity
And maturity, in this case, is the value that is configured in the indicator settings, for example:
"EUR" => "EU" + "02Y" will result in EU02Y -> which will be used in the formula, depending on the quote or base currency.
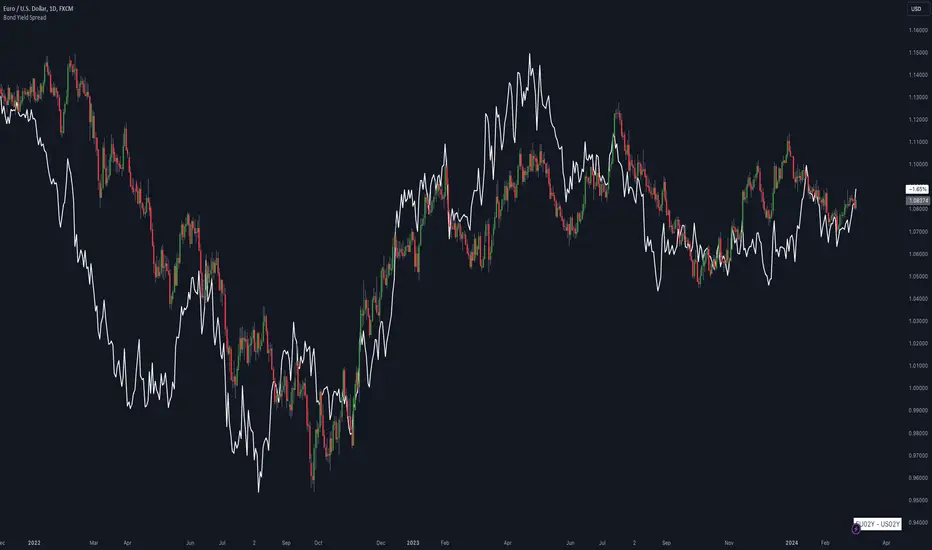
Application in Trading:
This indicator is invaluable for traders employing carry trading strategies or assessing currency strength based on traded interest rates as an indicator. A higher yield spread typically indicates a stronger currency, because the return obtained for holding the currency is higher.
Originality and Practicality:
This script is self-developed, aiming to fill the gap in automatic bond yield comparisons within the TradingView environment. It is particularly beneficial for traders focusing on macroeconomic factors affecting forex markets. Unlike other scripts, it integrates various bond maturities into one tool, enhancing its utility and application range.
Conclusion:
Designed for traders incorporating macroeconomics in their strategy, this script will be useful to calculate the bond yield differences automatically without having to enter a new formula for every new currency pair.
Compliance and Limitations:
The script complies with TradingView scripting standards, ensuring no lookahead bias and maintaining real-time data integrity. However, its utility depends on the comprehensive availability of bond yield data within TradingView. As not all countries issue bonds for each listed maturity, this may limit the script’s application for certain currency pairs or specific maturities.
RAINBOW AVERAGES - INDICATOR - (AS) - 1/3
-INTRODUCTION:
This is the first of three scripts I intend to publish using rainbow indicators. This script serves as a groundwork for the other two. It is a RAINBOW MOVING AVERAGES indicator primarily designed for trend detection. The upcoming script will also be an indicator but with overlay=false (below the chart, not on it) and will utilize RAINBOW BANDS and RAINBOW OSCILLATOR. The third script will be a strategy combining all of them.
RAINBOW moving averages can be used in various ways, but this script is mainly intended for trend analysis. It is meant to be used with overlay=true, but if the user wishes, it can be viewed below the chart. To achieve this, you need to change the code from overlay=true to false and turn off the first switch that plots the rainbow on the chart (or simply move the indicator to a new pane below). By doing this, you will be able to see how all four conditions used to detect trends work on the chart. But let's not get ahead of ourselves.
-WHAT IS IT:
In its simplest form, this indicator uses 10 moving averages colored like a rainbow. The calculation is as follows:
MA0: This is the main moving average and can be defined with the type (SMA, EMA, RMA, WMA, SINE), length, and price source. However, the second moving average (MA1) is calculated using MA0 as its source, MA2 uses MA1 as the data source, and so on, until the last one, MA9. Hence, there are 10 moving averages. The first moving average is special as all the others derive from it. This indicator has many potential uses, such as entry/exit signals, volatility indication, and stop-loss placement, but for now, we will focus on trend detection.
-TREND DETECTION:
The indicator offers four different background color options based on the user's preference:
0-NONE: No background color is applied as no trend detection tools is being used (boring)
1-CHANGE: The background color is determined by summing the changes of all 10 moving averages (from two bars). If the sum is positive and not falling, the background color is GREEN. If the sum is negative and not rising, the background color is RED. From early testing, it works well for the beginning of a movement but not so much for a lasting trend.
2-RAINBW: The background color is green when all the moving averages are in ascending order, indicating a bullish trend. It is red when all the moving averages are in descending order, indicating a bearish trend. For example, if MA1>MA2>MA3>MA4..., the background color is green. If MA1 threshold, and red indicates width < -threshold.
4-DIRECT: The background color is determined by counting the number of moving averages that are either above or below the input source. If the specified number of moving averages is above the source, the background color is green. If the specified number of moving averages is below the source, the background color is red. If all ten MAs are below the price source, the indicator will show 10, and if all ten MAs are above, it will show -10. The specific value will be set later in the settings (same for 3-TSHOLD variant). This method works well for lasting trends.
Note: If the indicator is turned into a below-chart version, all four color options can be seen as separate indicators.
-PARAMETERS - SETTINGS:
The first line is an on/off switch to plot the skittles indicator (and some info in the tooltip). The second line has already been discussed, which is the background color and the selection of the source (only used for MA0!).
The line "MA1: TYP/LEN" is where we define the parameters of MA0 (important). We choose from the types of moving averages (SMA, EMA, RMA, WMA, SINE) and set the length.
Important Note: It says MA1, but it should be MA0!.
The next line defines whether we want to smooth MA1 (which is actually MA0) and the period for smoothing. When smoothing is turned on, MA0 will be smoothed using a 3-pole super smoother. It's worth noting that although this only applies to MA0, as the other MAs are derived from it, they will also be smoothed.
In the line below, we define the type and length of MAs for MA2 (and other MAs except MA0). The same type and length are used for MA1 to MA9. It's important to remember that these values should be smaller. For example, if we set 55, it means that MA1 is the average of 55 periods of MA0, MA2 will be 55 periods of MA1, and so on. I encourage trying different combinations of MA types as it can be easily adjusted for ur type of trading. RMA looks quirky.
Moving on to the last line, we define some inputs for the background color:
TSH: The threshold value when using 3-TSHOLD-BGC. It's a good idea to change the chart to a pane below for easier adjustment. The default values are based on EURUSD-5M.
BG_DIR: The value that must be crossed or equal to the MA score if using 4-DIRECT-BGC. There are 10 MAs, so the maximum value is also 10. For example, if you set it to 9, it means that at least 9 MAs must be below/above the price for the script to detect a trend. Higher values are recommended as most of the time, this indicator oscillates either around the maximum or minimum value.
-SUMMARY OF SETTINGS:
L1 - PLOT MAs and general info tooltip
L2 - Select the source for MA0 and type of trend detection.
L3 - Set the type and length of MA0 (important).
L4 - Turn smoothing on/off for MA0 and set the period for super smoothing.
L5 - Set the type and length for the rest of the MAs.
L6 - Set values if using 4-DIRECT or 3-TSHOLD for the trend detection.
-OTHERS:
To see trend indicators, you need to turn off the plotting of MAs (first line), and then choose the variant you want for the background color. This will plot it on the chart below.
Keep in mind that M1 int settings stands for MA0 and MA2 for all of the 9 MAs left.
Yes, it may seem more complicated than it actually is. In a nutshell, these are 10 MAs, and each one after MA0 uses the previous one as its source. Plus few conditions for range detection. rest is mainly plots and colors.
There are tooltips to help you with the parameters.
I hope this will be useful to someone. If you have any ideas, feedback, or spot errors in the code, LET ME KNOW.
Stay tuned for the remaining two scripts using skittles indicators and check out my other scripts.
-ALSO:
I'm always looking for ideas for interesting indicators and strategies that I could code, so if you don't know Pinescript, just message me, and I would be glad to write your own indicator/strategy for free, obviously.
-----May the force of the market be with you, and until we meet again,

MTFT VWAPs Auto AnchoredMulti Time Frame Tools
Multi Time Frame Tools (MTFT) is a suite of scripts aimed to establish a standard timeframe-based color scheme. This can be utilized to overlay different timeframes calculations/values over a single timeframe. As one example, this would allow to observe the 5-month moving average, 5-week moving average, and 5-day moving average overlaid over each other. This would allow to study a chart, get accustomed to the color scheme and study all these at the same time much easier.
All indicators calculated using the below specific timeframes as input, will always use the color scheme outlined below. This is to get you in habit of recognizing the different timeframes overlaid in top of each other. These can be personalized.
Longer TF analysis.
Yearly - Black
Semi-Annual - Yellow
Quarterly - White
Monthly - Maroon
Weekly - Royal Blue
Daily - Lime
Shorter TF analysis.
4 hour - Fuchsia
1 hour - Orange
30 min - Red
15 min - Brown
10 min - Purple
5 min - Lilac
All color coordination is able to be modified in either the “Inputs” or “Style” section. If you need to make changes, make sure to select “Save as Default” on the bottom right of the settings menu.
Recommended Chart Color Layout
I played around with color coordination a lot. The final product was what worked best for me. I personally use the following chart settings to accent all available TF colors.
-> Click on the settings wheel on your chart. -> Click on “Appearance”.
Background - Solid -> On the top row pick the 6th color from the left.
Vert Grid Lines and Horz Grid Lines -> On the top row pick the 7th color from the left.
You may of course change these and the indicator line colors as you like.
Adding indicator to Chart
-> Open the TradingView “Indicators & Strategies” library, the icon has “ƒx”. -> All premium scripts will be located under “Invite-Only Scripts” -> Click indicator to add to your chart.
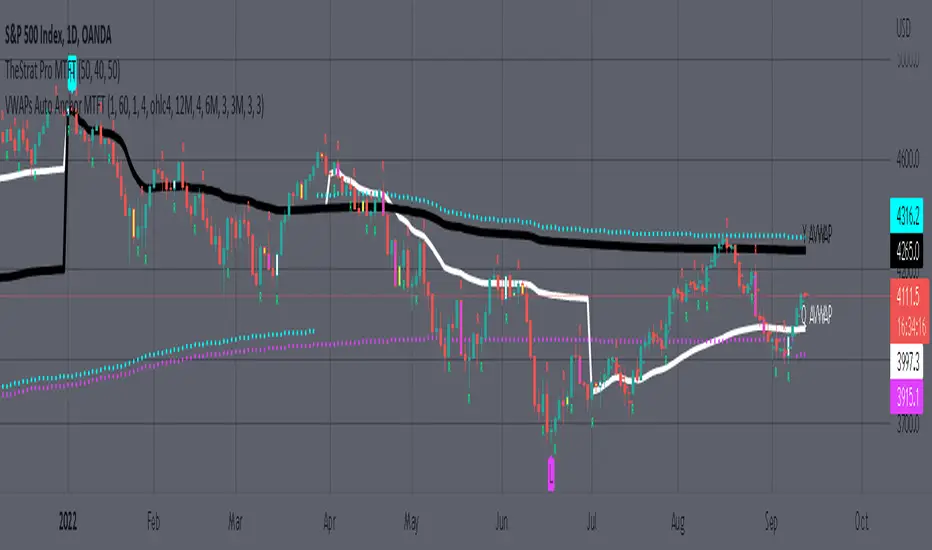
MTFT VWAPs Auto Anchored
The Anchored Volume-Weighted Average Price, Anchored VWAP, is a commonly discussed FinTwit tool. I personally found it through Brian Shannon on Twitter. I have seen big FinTwit accounts solely focus on this strategy alone and have seen other big FinTwit accounts mix with their other indicators. I will be providing very basic info to utilize this script; it is up to you to dive deep into learning this strategy. I am not an expert with the tool or a financial advisor. As with all aspects of life, I recommend you research, learn, discern and practice extensively in order to become a master.
The script has the following features.
1. Three user selected time frames auto anchored VWAPS. It will auto anchor to the start of the timeframe. Timeframes(TF) include: Yearly(Y), Semi-annually(S), Quarterly(Q), Monthly(M), Weekly(W), Daily(D), and 4 hour. Image below shows the D candlestick as the active timeframe, the anchored VWAPs for the Year, Quarter, and Month.
2. Auto hide lower timeframe calculations. Auto Hide feature will hide smaller TF calculations when a larger timeframe is selected as the display TF. Example, when the Daily timeframe candlestick selected the Weekly and Daily Anchored VWAPs are hidden because they produce very noisy results. If a lower TF is selected such as the 30 min candlestick, the previously hidden Daily and Weekly Open Anchored VWAPs are now displayed. Notice that this specific indicator calculates different with every different timeframe that is selected. The lower TF calculations are more accurate as they include additional information. Image below shows the 30 min timeframe selected with the Daily, Weekly, and Monthly Open Anchored VWAPs displayed.
3. Auto Anchor using Pivot High/Low locations. Script finds the pivot highs/lows with a user selected look back/forward period. Additionally, as new pivot highs/lows appear you can choose to keep up to 4 each previous pivot high/low anchored VWAPs displayed. Image below has a 40 look back/forward period selected, and 2 past AVWAPs enabled.
You may notice in the above image that there is a gap between the AVWAP plot and the marked pivot point. This is not something that can be avoided as the script has to look forward in order to verify the pivot. The calculation is still correct, this can be verified by manually adding an “Anchored VWAP” drawing and seeing the values align. Image below shows that they match. White lines are the manually added “Anchored VWAP” drawings. If you verify this for yourself, make sure to select the correct input source in the settings of the drawing.
4. Auto Anchored on IPO High/Low. Looks for the first available candlestick in a chart and anchors to the high and low. This is useful with newer companies with recent IPOs.
IMPORTANT NOTE to TradingView admin: One of the lessons I would consider most important in attaining clarity regarding trading, is “TheStrat” by Rob Smith. His lesson on “actionable signals” is something that can be applied to any strategy. For this reason, I am including “MTFT TheStrat Patterns Pro” script in all images that will depict confluence for a better trade selection.
Example using TheStrat Pro MTFT with this indicator.
Look for a “TheStrat actionable signal” or a “TheStrat Reversal signal” on a smaller timeframe that has an instance of this indicator on a larger timeframe calculation that is in range of the candlestick that formed your actionable signal. This means that the indicators plot you are observing must be above the low and below the high of the candlestick that is the actionable signal/reversal signal.
The Image below shows what this would look like with this indicator. The selected candlestick is the 2-day, it shows a 1-3-1 pattern and the Quarter Anchored VWAP in range. This actionable signal could be played in both directions. If the high is breached, you would enter a long position from the high of the inside candlestick. If the low is breached than you would enter a short. For targets you would look at the previous pivots, for this example all targets were hit. Note that the “Entry” and “Targets” line were added manually and are not part of the script. Setups won’t always play out so nice and clean, but given that there is so many stocks and so many signals this is just a thought to improve the quality of the signal as it has extra confluence. If you are interested in learning further, research ‘TheStrat’ by Rob Smith.
MTFT EMA CloudsMulti Time Frame Tools
Multi Time Frame Tools (MTFT) is a suite of scripts aimed to establish a standard timeframe-based color scheme. This can be utilized to overlay different timeframes calculations/values over a single timeframe. As one example, this would allow to observe the 5-month moving average, 5-week moving average, and 5-day moving average overlaid over each other. This would allow to study a chart, get accustomed to the color scheme and study all these at the same time much easier.
All indicators calculated using the below specific timeframes as input, will always use the color scheme outlined below. This is to get you in habit of recognizing the different timeframes overlaid in top of each other. These can be personalized.
Longer TF analysis.
Yearly - Black
Semi-Annual - Yellow
Quarterly - White
Monthly - Maroon
Weekly - Royal Blue
Daily - Lime
Shorter TF analysis.
4 hour - Fuchsia
1 hour - Orange
30 min - Red
15 min - Brown
10 min - Purple
5 min - Lilac
All color coordination is able to be modified in either the “Inputs” or “Style” section. If you need to make changes, make sure to select “Save as Default” on the bottom right of the settings menu.
Recommended Chart Color Layout
I played around with color coordination a lot. The final product was what worked best for me. I personally use the following chart settings to accent all available TF colors.
-> Click on the settings wheel on your chart. -> Click on “Appearance”.
Background - Solid -> On the top row pick the 6th color from the left.
Vert Grid Lines and Horz Grid Lines -> On the top row pick the 7th color from the left.
You may of course change these and the indicator line colors as you like.
Adding indicator to Chart
-> Open the TradingView “Indicators & Strategies” library, the icon has “ƒx”. -> All premium scripts will be located under “Invite-Only Scripts” -> Click indicator to add to your chart.
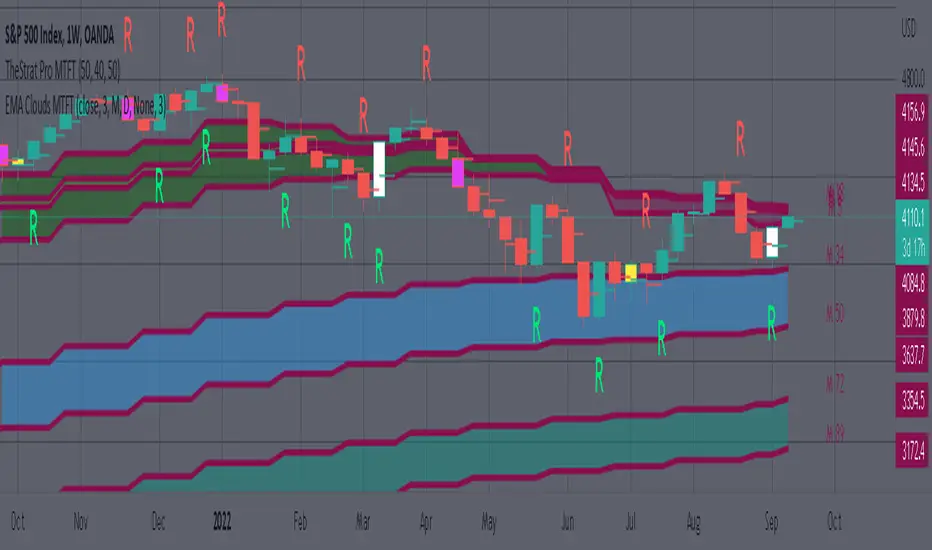
*** MTFT EMA Clouds ***
The Exponential Moving Average Clouds, EMA Clouds, is a commonly discussed FinTwit tool. I personally found it through Ripster47 and PatternProfits on Twitter. I have seen big FinTwit accounts solely focus on this strategy alone and have seen other big FinTwit accounts mix with their other indicators. I will be providing very basic info to utilize this script; it is up to you to dive deep into learning this strategy. I am not an expert with the tool or a financial advisor. As with all aspects of life, I recommend you research, learn, discern and practice extensively in order to become a master.
The script has the following features.
1. Two user selected timeframes(TF) per script instance. Timeframes include: Quarter, Month, Weekly, Daily, 4 hour, 1 hour, 30 min, 15 min, 10 min, and 5 min candlestick data.
2. Five Unique Clouds per selected timeframe can each be individually enabled/disabled. Cloud pairs include: 5&13, 8&9, 34&50, 72&89, and 180&200.
Below are some examples of how switching between multiple TF’s could assist you in identifying patterns and resistance/support easier. Below are 4 different timeframe EMA Clouds plotted over similar areas. What supports/resistances do you see?
Weekly timeframe selected with Quarterly Clouds
Weekly timeframe selected with Monthly Clouds
Daily timeframe selected with Weekly Clouds
1-hour timeframe selected with Daily Clouds.
This is meant to show you that the EMA Clouds often serve as resistance/support on multiple timeframes.
3. Force a specific cloud on both selected timeframes. Maybe you want to see how one cloud on several TFs looks over the same chart. Here I added two instances of the script in order to show 4 different TF clouds (Q, M, W, and D). Then I selected the “8_9” on “Force single cloud” for each instance, which will force only the selected cloud to be forced on all the selected time frames.
IMPORTANT NOTE: One of the lessons I would consider most important in attaining clarity regarding trading, is “TheStrat” by Rob Smith. His lesson on “actionable signals” is something that can be applied to any strategy. For this reason, I am including “MTFT TheStrat Patterns Pro” script in all images that will depict confluence for a better trade selection.
Example using TheStrat Pro MTFT with this indicator.
Look for a “TheStrat actionable signal” or a “TheStrat Reversal signal” on a smaller timeframe that has an instance of this indicator on a larger timeframe calculation that is in range of the candlestick that formed your actionable signal. This means that the indicators plot you are observing must be above the low and below the high of the candlestick that is the actionable signal/reversal signal. Image below shows what this would look like with this indicator.
The Image below shows what this would look like with this indicator. The selected candlestick is the Weekly, it shows a hammer actionable signal and the Monthly 34 EMA in range. This actionable signal is meant to be played in a long position. If the high is breached, you would enter a long position from the high of the hammer candlestick. For targets you would look at the previous pivots, for this example all targets were hit. Note that the “Entry” and “Targets” line were added manually and are not part of the script. Setups won’t always play out so nice and clean, but given that there is so many stocks and so many signals this is just a thought to improve the quality of the signal as it has extra confluence. If you are interested in learning further, research ‘TheStrat’ by Rob Smith.
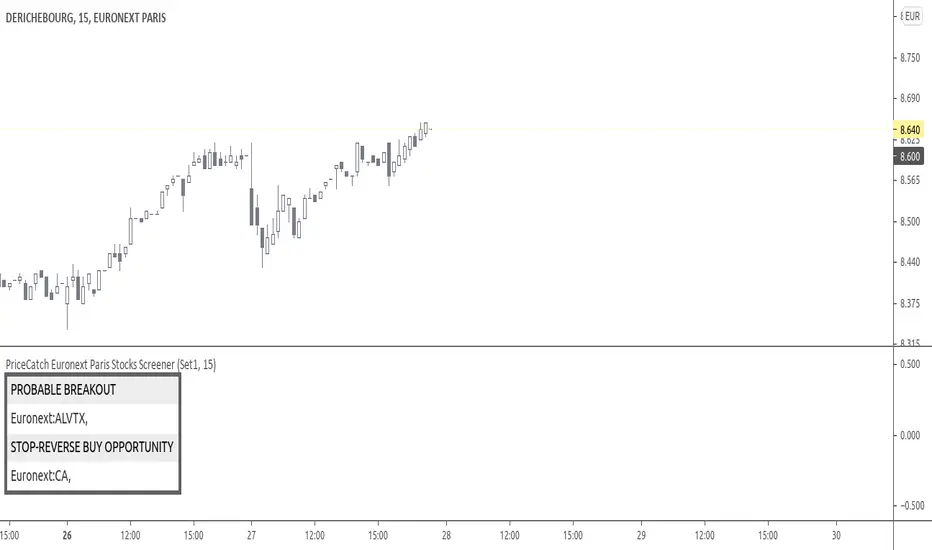
PriceCatch Euronext Paris Stocks Screener v1Hi,
Tradingview community. Warm Greetings.
Euronext Paris Stocks Screener
I am sharing a script that screens Euronext Paris stocks for Probable Breakout Buy signal and Stop-Reverse Buy Signal. This script may prove to be useful to traders who trade Euronext Paris listed stocks.
I have already shared the script "PriceCatch Signals Buy Signals" that marks the following levels on the chart.
Probable Breakout Buy Level
Stop-Reverse Buy Level
While the script "PriceCatch Signals Buy Signals" can be used independently, this script is intended to be used with the script "PriceCatch Signals Buy Signals".
Used together, these two scripts may help you identify probable buy opportunities. The purpose of this script is to help screen stocks quickly without manually going through every stock in your watchlist.
Please read the Notes of the script "PriceCatch Signals Buy Signals" for explanation of its functionality.
Stocks Set
As Tradingview limits the number of security function calls, to get around, you have to select Set1 to screen first set of 25 stocks and then select Set2 to screen next set of 25 stocks.
List of Euronext Paris stocks
ACA AI AIR ALCRB ALGAU ALO ALONC ALVTX ATO BN BNP CA CLA COFA CS DBG DG EDF
EL ELIOR EN ENGI ETL FDJ FR FTI GET GLE MCPHY OR ORA POXEL PUB RI
RNO RXL SAF SAN SGO SMCP STLA STM SU TE TTE VIE VIV VK VLA WLN
Chart resolution vs. Script resolution
I have noticed that if the chart resolution is set to 15 minutes time-frame and the screener resolution is selected as 2 Hours, then the results are correct. However, if the screener resolution is set to 5 minutes, then the results are not accurate. This is not an issue with script. So scanning higher time-frames from a lower time-frame chart works better. My advice however, is better to set the chart resolution to the same interval as screener resolution for sure results.
As usual with price action, longer time-frames produce more reliable signals.
SOME CHARTS
Chart set to Daily time-frame and shows Derichebourg stock. Screener shows a Stop-Reverse Buy Opportunity on GET.
s3.tradingview.com
Example 2
Chart set to 30 min. timeframe and shows Derichebourg stock. Screener shows a Stop-Reverse Buy Opportunity on VIV .
s3.tradingview.com
NOTE - PRIOR TO USING THIS SCRIPT
Please remember that the script is shared with absolutely no assurances about usability and any warranties whatsoever and as a responsible trader, please satisfy yourselves thoroughly and use it only if you are satisfied it works for you. Remember, you are 100% responsible for your actions. If you understand and accept that, you may use the script.
QUERIES/FEEDBACK
Please PM me.
Regards to all and wish everyone all the best with trading.
Dankland Playground Moneymaker - V2“version 2” of my playground bot script. Its essentially a powerhouse suite of strategies. Although it is similar to the previous script, it nets different results as sections have been changed. Such as the somewhat reluctant removal of the Chande Momentum... The RSIs have also been updated, this was one of the main changes. RSIS now include a Moving Average cross of RSI to generate signals above and below the given thresholds instead of simply on crossing a threshold. This should give greater functionality overall. Most functions including Moving Averages have been updated to include a wider range of kinds of moving averages. This includes not just the moving average cross, but MACD and RSIs as well. I tried to perform the same upgrade on the %B, Stochastics and SMI, but hit the unpacked code limit of 60,000 lines... So, more “versions” will have to come for future “upgrades”, with the recognition that there will be cases where the old, “downgraded” versions may perform better and that some people (like myself) may continue to use them on some markets until I/we devise superior settings on the new ones for said markets. For instance, instead of replacing my 1 hr BTCUSD bot (where I used the now deleted Chande to pretty pleasing affect...) I made a new one for LINKUSD 10 min so I can have both running for now and work on replacing the BTCUSD later.
How it works basically is this... you have 16 oscillators which can all be used as independently as you wish. They can be split up into different groups or ran all together.
When in separate groups they should not be able to sell eachothers positions without triggering a full stop loss by turning the Independence/Stop All switches on. Every single oscillator has its own entry and exit position sizing which can be stated as either a percent of balance or a flat amount of contracts (or both combined). Each oscillator has a minimum amount of profit you can tell it to sell it, which is calculated from the average cost of your current position, which does include all groups. This works out to help you average out better entry and exit prices, essentially a method of DCAing.
You can set the minimum sale amount, which is to keep it from placing orders below your exchanges minimum dollar trade cost.
All this functionality combined also ensures more accurate back tests by ensuring that the script simply cannot spend money it doesn't see as in the balance, whereas other scripts will use a percentage of equity, and once 100% of your equity is in BTC for instance, it will keep buying more BTC for free and thus spoof up backtest numbers. If you look through the strategies here, many people claim to have amazing scripts and then you look into it and this is happening and skewing their numbers. These people are either very ignorant or what they made or scam artists and trolls in my opinion.
This version also includes On Bar Close switches for each oscillator. When switched on, signals are only allowed to generate on Bar Close. This helps to prevent retriggering from live signals, which when you are running this many oscillators, will become a problem! However, in most cases, you do not need to generate signals intrabar, as backtests will show, ignoring intrabar buys and sells (intrabar stop losses can still be very important though!) won't exactly keep you from high profitability strategies, but rather, allowing elements of chaos from live indicators moving up and down intrabar will, in fact, drift your actual results further and further from the backtest. You want an accurate backtest though. So choose wisely when you turn these off and you will do better.
The included oscillators are as follows:
NO MORE Chande Momentum cross – REMOVED – I was hitting PINE code limits here so I had to make choices and this one simply had to go. Begone!
Moving Average Cross
MACD cross
%B Bollinger cross
Stochastic cross + region filter
Stochastic RSI cross + region filter
SMII cross and region filter
Three RMIs
Know-Sure-Thing line-cross
Coppock Curve line-cross
TRIX line-cross
RSI of MA w/ MA cross
RSI of MA of KST w/ MA cross
RSI of MA of Coppock Curve w/ MA cross
RSI of MA of Trix w/ MA cross
So the idea is that this is essentially multiple strategies combined into one backtestable house. Balance is calculated for all position sizes in order to try to prevent false entries that plague so many scripts (IE, you set pyramiding to 2, each buy $1000, initial balance $1000, and yet it buys two orders off the bat for $2000 total and nets 400% profit because the second was considered free, happens on 90+% of scripts on Tradingview if you aren't very very careful!)
You tune each indicator and position size them so that they work together as well as you can and in doing so you are able to create a single backtest that is capable of running a bot, essentially, between multiple strategies - you can run a slower Moving Average cross, a faster SMI cross or MACD , or Bollinger that grabs big moves only, all the while having MACD trade small bonuses along the way. This way you can weight the Risk to Reward of each against eachother.
I will not try to claim this is something you can open and with no work have the best bot on the planet. This scripts intention is to take a lot of relatively common trading strategies and combine them under on roof with some risk management and the ability to weigh each against eachother.
If you are looking for a super advanced singular algorithm that tries to capture every peak and valley exactly on the dot, this is not for you. If you are looking for a tool with a high level of customizability, with a publisher who intends to update it to the best of his ability in accordance to seeking to make the best product that I personally can make for both myself and the community (because I will be using this myself of course!) that was specifically designed with the intention of performing well in spot markets by averaging low entry costs and high exit costs, this is for you! That is the exact intention here. It can certainly work with margin, but you will have to take extra care in setting your stop losses. I intend to make a version capable of going short which will be included as part of the package. It may take some work to keep all of the risk management working as well for shorts though. There will be more scripts added to the “package” as I hit the limit on this one a few times and have had to keep some ideas out already.
The current backtest shown is hand-optimized by myself for Link /USD 10min market (Binance US – shouldn't need much work to fit to other exchange markets) with multiple stop losses.

Fractal Trend Trading System [DW]This is an advanced utility that uses fractal dimension and trend information to generate useful insights about price activity and potential trade signals.
In this script, my Advanced FDI algorithm is used to estimate the fractal dimension of the dataset over a user defined period.
Fractal dimension, unlike spatial or topological dimension, measures how complexity or detail in an "object" changes as its unit of measurement changes, rather than the number of axes it occupies.
Many forms of time series data (seismic data, ECG data, financial data, etc.) have been theoretically shown to have limited fractal properties.
Consequently, we can estimate the fractal dimension from this data to get an approximate measure of how rough or convoluted the data stream is.
Financial data's fractal dimension is limited to between 1 and 2, so it can also be used to roughly approximate the Hurst Exponent by the relationship H = 2 - D.
When D=1.5, data statistically behaves like a random walk. D above 1.5 can be considered more rough or "mean reverting" due to the increase in complexity of the series.
D below 1.5 can be considered more prone to trending due to the decrease in complexity of the series.
In this script, you are given the option to apply my Band Shelf EQ algorithm to the dataset before estimating dimension.
This enables you to transform your data and observe how its newly measured complexity changes the outputs.
Whether you want to give emphasis to some frequencies, isolate specific bands, or completely alter the shape of your waveform, EQ filtration makes for an interesting experience.
The default EQ preset in this script removes the low shelf, then attenuates low end and high end oscillations.
The dominant cyclical components (bands 3 - 5 on default settings) are passed at 100%, keeping emphasis on 8 to 64 sample per cycle oscillations.
The estimated dimension is then used to calculate the High Dimension Zone and the Error Bands.
Both of these components are great for analyzing trends and for estimating support and resistance values.
The High Dimension Zone is composed of a high line, low line, and midline that update their values when D is at or above the user defined zone activation threshold.
The zone is then averaged over a user defined amount of updates and zone width is multiplied by a user defined value.
The Error Bands are composed of a high, low, and middle band that are calculated using an error adjusted adaptive filter algorithm that utilizes dimension as the smoothing constant modulator.
The basis filter for the error bands has two calculation types built in:
-> MA - Calculates the filters as adaptive moving averages modulated by D.
-> WAP - Calculates the filters as adaptive weighted average prices modulated by D.
The WAP starting point can be based on the High Dimension Zone being moved or a user defined interval.
You can also define the WAP's minimum and maximum periods for additional control of the initial and decayed sensitivity states.
The alpha (smoothing constant) modulator can be fine tuned using the designated dimension thresholds.
When D is at or below the low dimension threshold, the filter is most responsive, and vice-versa for the high dimension threshold.
Alpha is then multiplied by a user defined amount for additional control of sensitivity.
Band width is then multiplied by a user defined value.
A Hull transformation can be optionally performed on the zone averaging and band filter algorithms as well, which will alter the frequency and phase responses at the cost of some overshoot.
This transformation is the same as a typical Hull equation, but with custom filters being used instead of WMA.
The calculated outputs are then used to gauge the trend for signal and color scheme calculations.
First, a dominant trend indication is selected from its designated dropdown tab.
The available built in indications to choose from are:
-> Band Trend (Outer) - Detects band breakouts and saves their direction to gauge trend.
-> Band Trend (Median) - Uses disparity between source and the band median to gauge trend.
-> Zone Trend (Expansion) - Detects when the high fractal zone expands and saves its direction to gauge trend.
-> Zone Trend (Outer Levels) - Detects zone breakouts and saves their direction to gauge trend.
-> Zone Trend (Median) - Uses disparity between source and the zone median to gauge trend.
Then the trend output is optionally filtered before triggering signals.
There are multiple trend filtration options built into this script that can be used individually or in unison:
-> Filter Trend With High Fractal Zone - Filters the trend using the specified zone level or combination of levels with either disparity or crossover conditions.
There is a set of options for bullish and bearish trends.
-> Filter Trend With Error Bands - Filters the trend using the specified band level or combination of levels with either disparity or crossover conditions.
There is a set of options for bullish and bearish trends.
-> Filter Trend With Band - Zone Disparity Condition - Filters the trend using the specified band level, zone level, and disparity direction.
There is a set of options for bullish and bearish trends.
-> Filter By Zone That Moves With The Trend - Filters the specified trend by detecting when the high fractal zone’s direction correlates.
-> Filter By Bands That Move With The Trend - Filters the specified trend by detecting when the error bands’ direction correlates.
-> Filter Using Wave Confirmation - Filters the specified trend by detecting when source is in a correlating wave with user defined length.
You can also choose separate lengths for bullish and bearish trends.
-> Filter By Bars With Decreasing Dimension - Filters the specified trend by detecting when fractal dimension is decreasing, suggesting source is approaching more linear movement.
The filtered trend output is then used to generate entry and exit signals.
There are multiple options included to fine tune how these signals behave.
For entries, you have the following options built in:
-> Limit Entry Dimension - Limits the range of dimensional values that are acceptable for entry with user defined thresholds.
This can be incredibly useful for filtering out entries taken when price is moving in a more complex pattern,
or when price is approaching a peak and you’re a little late to the party.
-> Enable Position Increase Signals - Enables more entry signals to fire up to a user defined number of times when a position is active.
This is helpful for those who incrementally increase their positions, or for those who want to see additional signals as reference.
-> Limit Number Of Consecutive Trades - Limits the number of consecutive trades that can be opened in a single direction to a user defined maximum.
This is especially useful for markets that only trend for brief durations.
By limiting the amount of trades you take in one direction, you have more control over your market exposure.
There is a set of these options for both bullish and bearish entries.
For exits, you have the following options built in:
-> Include Exit Signals From High Fractal Zone - Enables exit signals generated from either crossover or disparity conditions between price and a specified zone level.
-> Include Exit Signals From Error Bands - Enables exit signals generated from either crossover or disparity conditions between price and a specified zone level.
-> Include Inactive Trend Output For Exits - Triggers exit signals when the filtered trend output is an inactive value.
-> Dimension Target Exit Method - Triggers exit signals based on fractal dimension hitting a user defined threshold.
You can either choose for the exit to trigger instantly, or after dimension reverts from the target by a user specified amount.
-> Exit At Maximum Entry Dimension - Triggers exit signals when dimension exceeds the maximum entry limit.
-> Number Of Signals Required For 100% Exit - Controls the number of exit signals required to close the position.
You can also choose whether or not to include partial exits.
Enabling them will fire a partial signal when an exit occurs, but the position is not 100% closed.
Of course, there is a set of these options for bullish and bearish exits.
In my opinion, no system is complete without some sort of risk management protocol in place.
So in this script, bullish and bearish trades come equipped with optional protective SL and TP levels with signals.
The levels can be fixed or trailing, and are calculated with a user defined scale.
The available scales for SL and TP distances are ticks, pips, points, % of price, ATR, band range, zone range, or absolute numerical value.
Now what if you have some awesome signals of your own that you’d like to use in conjunction with this script?
Well good news. You can!
In addition to all of the customizable features built into the script, you can integrate your own signals into the system using the external data inputs and linking your script.
This adds a whole new layer of customization to the system.
With external signals, you can use your own custom dominant trend indication, filter the dominant trend, and trigger exits and protective stops using custom signals.
The signal input is an integer format. 1=Bull Signal, -1=Bear Signal, 2=Bull Exit, -2=Bear Exit, 3=Bull SL Hit, -3=Bear SL Hit, 4=Bull TP Hit, -4=Bear TP Hit.
You can also use the external input as a custom source value for either dimension or global sources to further tailor the system to your liking.
The color scheme in this script utilizes two custom gradients that can be chosen for bar and background colors:
-> Trend (Dominant or Filtered) - A polarized gradient that shows green scaled values for bullish trend and red scaled values for bearish trend.
The colors are brighter and more vibrant as perceived trend strength increases.
-> Dimension - A thermal gradient that shows cooler colors when dimension is higher, and hotter colors when dimension is lower.
Both color schemes are dependent on the designated dimension thresholds.
The script comes equipped with alerts for entries, additional entries, exits, partial exits, and protective stops so you can automate more and stare at your charts less.
And lastly, the script comes equipped with additional external outputs to further your analysis:
-> Entry And Exit Signals - Outputs in the same format as the external signal input with these additions: 5=Bull Increase, -5=Bear Increase, 6=Bull Reduce, -6=Bear Reduce.
You can use these to send to other scripts, including strategy types so you can backtest your performance on TV’s engine.
-> Dominant Trend - Outputs 1 for bullish and -1 for bearish. Can be used to send trend signals to another script.
I designed this tool with individuality in mind.
Every trader has a different situation. We trade on different schedules, markets, perspectives, etc.
Analytical systems of basically any type are very seldom (if ever) “one size fits all” and usually require a fair amount of modification to achieve desirable results.
That’s why this system is so freely customizable.
Your system should be flexible enough to be tailored to your analytical style, not the other way around.
When a system is limited in what you can control, it limits your experience, analytical potential, and possibly even profitability.
This is not your typical pre-set system. If you're looking for just another "buy, sell" script that requires minimal thought, look elsewhere.
If you’re ready to dive into a powerful technical system that allows you to tailor the experience to your style, welcome!
-----------------------------------------------------------------------------------------------------------------------------------------------------------------
This is a premium script, and access is granted on an invite-only basis.
To gain access, get a copy of the system overview, or for additional inquiries, send me a direct message.
I look forward to hearing from you!
-----------------------------------------------------------------------------------------------------------------------------------------------------------------
General Disclaimer:
Trading stocks, futures, Forex, options, ETFs, cryptocurrencies or any other financial instrument has large potential rewards, but also large potential risk.
You must be aware of the risks and be willing to accept them in order to invest in stocks, futures, Forex, options, ETFs or cryptocurrencies.
Don’t trade with money you can’t afford to lose.
This is neither a solicitation nor an offer to Buy/Sell stocks, futures, Forex, options, ETFs, cryptocurrencies or any other financial instrument.
No representation is being made that any account will or is likely to achieve profits or losses of any kind.
The past performance of any trading system or methodology is not necessarily indicative of future results.
TFi Pivot Reversal StudyThe Pivot Reversal Study script uses pivot points to create a support and resistance level; based on this levels the script creates virtual stop-market orders to catch the trend if the price is crossing the pivot lines.
A configurable trailing-stop and stop-loss is being used to exit an open position.
The entry and exit points are visualized in the chart via green arrows and crosses; the position follows the exact behavior of the strategy script.
The study also creates alerts, which follow the exact position of the entry/exit markers. Via the input parameter "Alert Message Type" it is possible to select a predefined alertcondition message; right now the script supports a generic default message and a trading setup for Alertatron.
How to use
The study works with all timeframes; the current chart setting is using a 15min timeframe. The strategy enters about 10 trades per day, depending on the used settings.
I'm also providing a "strategy" version of this study, which can be used to backtest the strategy.
How to access
This strategy is a "Invite Only" script. You can can subscribe or purchase the strategy ; please use the link below or send me a message via Tradingview to obtain access to the strategy and study script.
For enabling the script in your Tradingview chart window, click on "Indicators" and select "Invite-Only Scripts".
Full list of alerts:
'Enter Long' ... Enter long position
'Enter Short' ... Enter short position
'Exit Long PT' ... Exit long position - profit-target reached
'Exit Short PT' ... Exit short position - profit-target reached
'Exit Long SL' ... Exit long position - stop-loss
'Exit Short SL' ... Exit short position - stop-loss
Full list of parameters:
"Pivot Left Bars" ... Number of bars on the left of the pivot point - used for pivot/peak detection
"Pivot Right Bars" ... Number of bars on the right of the pivot point - used for pivot/peak detection
"Entry Offset " ... Entry price offset after crossing pivot line (in %)
"Trailing Activation Level " ... Trailing stop activation level above/below average price (in %)
"Trailing Offset " ... Trailing stop price (in %)
"Stop Loss " ... Absolute stop-loss (in %)
"Alert Message Type" ... Alert message type: generic or Alertatron
"Backtest ..." ... Backtest timeframe; area outside this timeframe will be grayed out
I'm looking forward to any feedback, reviews and change requests!

Total Trend Follow Strategy with Pyramid and DCA
Introduction
This is a Pine 4 trend following strategy. It has a twin study with several alerts. The design intent is to produce a commercial grade signal generator that can be adapted to any symbol and interval. Ideally, the script is reliable enough to be the basis of an automated trading system web-hooked to a server with API access to crypto, forex and stock brokerages. The strategy can be run in three different modes: long, short and bidirectional.
As a trend following strategy, the behavior of the script is to buy on strength and sell on weakness. As such the trade orders maintain its directional bias according to price pressure. What you will see on the chart is long positions on the left side of the mountain and short on the right. Long and short positions are not intermingled as long as there exists a detectable trend. This is extremely beneficial feature in long running bull or bear markets. The script uses multiple setups to avoid the situation where you got in on the trend, took a small profit but couldn’t get back in because the logic is waiting for a pullback or some other intricate condition.
Deep draw-downs are a characteristic of trend following systems and this system is no different. However, this script makes use of the TradingView pyramid feature accessible from the properties tab. Additional trades can be placed in the draw-down space increasing the position size and thereby increasing the profit or loss when the position finally closes. Each individual add on trade increases its order size as a multiple of its pyramid level. This makes it easy to comply with NFA FIFO Rule 2-43(b) if the trades are executed here in America. The inputs dialog box contains various settings to adjust where the add on trades show up, under what circumstances and how frequent if at all. Please be advised that pyramiding is an advanced feature and can wipe out your account capital if your not careful. During the backtest use modest setting with realistic capital until you discover what you think you can handle.
In addition to pyramiding this script employs DCA which enables users to experiment with loss recovery techniques. This is another advanced feature which can increase the order size on new trades in response to stopped out or winning streak trades. The script keeps track of debt incurred from losing trades. When the debt is recovered the order size returns to the base amount specified in the TV properties tab. The inputs for this feature include a limiter to prevent your account from depleting capital during runaway markets. The main difference between DCA and pyramids is that this implementation of DCA applies to new trades while pyramids affect open positions. DCA is a popular feature in crypto trading but can leave you with large “bags” if your not careful. In other markets, especially margin trading, you’ll need a well funded account and much experience.
Consecutive loss limit can be set to report a breach of the threshold value. Every stop hit beyond this limit will be reported on a version 4 label above the bar where the stop is hit. Use the location of the labels along with the summary report tally to improve the adaptability of system. Don’t simply fit the chart. A good trading system should adapt to ever changing market conditions. On the study version the consecutive loss limit can be used to halt live trading on the broker side (Managed manually).
Design
This script uses nine indicators on two time frames. The chart (primary) interval and one higher time frame which is based on the primary. The higher time frame identifies the trend for which the primary will trade. I’ve tried to keep the higher time frame around five times greater than the primary. The original trading algorithms are a port from a much larger program on another trading platform. I’ve converted some of the statistical functions to use standard indicators available on TradingView. The setups make heavy use of the Hull Moving Average in conjunction with EMAs that form the Bill Williams Alligator as described in his book “New Trading Dimensions” Chapter 3. Lag between the Hull and the EMAs form the basis of the entry and exit points. The alligator itself is used to identify the trend main body.
The entire script is around 1700 lines of Pine code which is the maximum incidental size given the TradingView limits: local scopes, run-time duration and compile time. I’ve been working on this script for over a year and have tested it on various instruments stocks, forex and crypto. It performs well on higher liquidity markets that have at least a year of historical data. Though it can be configured to work on any interval between 5 minutes and 1 day, trend trading is generally a longer term paradigm. For day trading the 10 to 15 minute interval will allow you to catch momentum breakouts. For intraweek trades 30 minutes to 1 hour should give you a trade every other a day. Four hours and above are for seasoned deep pocket traders. Originally, this script contained both range trading and trend following logic but had to be broken into separate scripts due to the aforementioned limitations.
Inputs to the script use cone centric measurements in effort to avoid exposing adjustments to the various internal indicators. The goal was to keep the inputs relevant to the actual trade entry and exit locations as opposed to a series of MA input values and the like. As a result the strategy exposes over 50 inputs grouped into long or short sections. Inputs are available for the usual minimum profit and stop-loss as well as safeguards, trade frequency, DCA, modes, presets, reports and lots of calibrations. The inputs are numerous, I’m aware. Unfortunately, at this time, TradingView does not offer any other method to get data in the script. The usual initialization files such as cnf, cfg, ini, json and xml files are currently unsupported.
Example configurations for various instruments along with a detailed PDF user manual is available.
Indicator Repainting And Anomalies
Indicator repainting is an industry wide problem which mainly occurs when you mix backtest data with real-time data. It doesn't matter which platform you use some form of this condition will manifest itself on your chart over time. The critical aspect being whether live trades on your broker’s account continue to match your TradingView study. Since this trading system is featured as two separate scripts, indicator repainting is addressed in the study version. The strategy (this script) is intended to be used on historical data to determine the appropriate trading inputs to apply in the study. As such, the higher time frame of this strategy will indeed repaint. Please do not attempt to trade from the strategy. Please see the study version for more information.
One issue that comes up when comparing the strategy with the study is that the strategy trades show on the chart one bar later than the study. This problem is due to the fact that “strategy.entry()” and “strategy_exit()” do not execute on the same bar called. The study, on the other hand, has no such limitation since there are no position routines. However, alerts that are subsequently fired off when triggered in the study are dispatched from the TradingView servers one bar later from the study plot. Therefore the alert you actually receive on your cell phone matches the strategy plot but is one bar later than the study plot. A lot can happen in four hours if you are trading off a 240 bar.
Please be aware that the data source matters. Cryptocurrency has no central tick repository so each exchange supplies TradingView its feed. Even though it is the same symbol the quality of the data and subsequently the bars that are supplied to the chart varies with the exchange. This script will absolutely produce different results on different data feeds of the same symbol. Be sure to backtest this script on the same data you intend to receive alerts for. Any example settings I share with you will always have the exchange name used to generate the test results.
Usage
The following steps provide a very brief set of instructions that will get you started but will most certainly not produce the best backtest. A trading system that you are willing to risk your hard earned capital will require a well crafted configuration that involves time, expertise and clearly defined goals. As previously mentioned, I have several example configs that I use for my own trading that I can share with you along with a PDF which describes each input in detail. To get hands on experience in setting up your own symbol from scratch please follow the steps below.
The input dialog box contains over 50 inputs separated into seven sections. Each section is identified as such with a makeshift separator input. There are three main areas that must to be configured: long side, short side and settings that apply to both. The rest of the inputs apply to pyramids, DCA, reporting and calibrations. The following steps address these three main areas only. You will need to get your backtest in the black before moving on to the more advanced features
Step 1. Setup the Base currency and order size in the properties tab.
Step 2. Select the calculation presets in the Instrument Type field.
Step 3. Select “No Trade” in the Trading Mode field.
Step 4. Select the Histogram indicator from section 3. You will be experimenting with different ones so it doesn’t matter which one you try first.
Step 5. Turn on Show Markers in Section 3.
Step 6. Go to the chart and checkout where the markers show up. Blue is up and red is down. Long trades show up along the blue markers and short trades on the red.
Step 7. Make adjustments to Base To Vertex and Vertex To Base net change and roc in section 3. Use these fields to move the markers to where you want trades to be. Blue is long and red is short.
Step 8. Try a different indicator from section 3 and repeat Step 7 until you find the best match for this instrument on this interval. This step is complete when the Vertex settings and indicator combination produce the most favorable results.
Step 9. Turn off Show Markers in Section 3.
Step 10. Enable the Symmetrical and Deviation calculation models at the top of section 5 and 6 (Symmetrical, Deviation).
Step 11. Put in your Minimum Profit and Stop Loss in the first section. This is in pips or currency basis points (chart right side scale)
Step 12. Return to step 3 and select a Trading Mode (Long, Short, BiDir, Flip Flop). If you are planning to trade bidirectionally its best to configure long first then short. Combine them with BiDir or Flip Flop after setting up both sides of the trade individually.
Step 13. Trades should be showing on the chart.
Step 14. Make adjustments to the Vertex fields in section 3 until the TradingView performance report is showing a profit.
Step 15. Change indicators and repeat step 14. Pick the best indicator.
Step 16. Use the check boxes in sections 5 and 6 to improve the performance of each side.
Step 17. Try adding the Correlation calculation model to either side. This model can sometimes produce a negative result but can be improved by enabling “Adhere To Markers” or “Narrow Correlation Scope” in the sections 5 and 6.
Step 18. Enable the reporting conditions in section 7. Look for long runs of consecutive losses or high debt sequences. These are indications that your trading system cannot withstand sudden changes in market sentiment.
Step 19. Examine the chart and see that trades are being placed in accordance with your desired trading model.
Step 20. Apply the backtest settings to the study version and perform forward testing.
This script is open for beta testing. After successful beta test it will become a commercial application available by subscription only. I’ve invested quite a lot of time and effort into making this the best possible signal generator for all of the instruments I intend to trade. I certainly welcome any suggestions for improvements. Thank you all in advance.
™TradeChartist Fib Extensions™TradeChartist Fib Extensions is a free to use script that helps traders plot Fibonacci Extensions on chart. Even though Trading View has a Fib extensions tool, some traders may prefer a plotting script like this with Fib plot lines extending across the whole of the chart to track historic prices in relation to Fib extensions drawn.
----To draw Fib extensions for uptrend ,
1. Choose a Pivot Low point (LL or a HL) as Pivot 1
2. Choose a Pivot High point (must be higher than Pivot 1) as Pivot 2
3. Choose a Pivot Low point (must be lower than Pivot 2, must be Higher than Pivot 1)
----To draw Fib extensions for downtrend,
1. Choose a Pivot High point (HH or a LH) as Pivot 1
2. Choose a Pivot Low point (must be lower than Pivot 1) as Pivot 2
3. Choose a Pivot High point (must be higher than Pivot 2 and lower than Pivot 1)
Negative extensions of -23.6% and -61.8% fib plots may be useful for some to spot reversals or to set stop losses.
Higher levels can be used if price goes beyond 161.8%
This is a free to use indicator. Give a thumbs up or leave a comment if you like the script
Check my 'Scripts' page to see other published scripts. Get in touch with me if you would like access to my invite-only scripts for a trial before deciding on a paid access for a period of your choice. Half-Yearly, Annual and Lifetime access available on invite-only scripts along with 1hr Team Viewer intro session.

CryptoSnaxAllinOne > 5 Scripts in 1 > Saving Time and Efficiency5 Scripts in 1 > Saving Time and Efficiency in My Daily Life
Tired of doing those repetivie tasks with Trading View?
- Spending Hours finding Support or Resistance?, Looking for Entry or Exit Signals? Looking for Pivot High/Low?
- Only to do it all again, when changing timeframes or asset!
- Fear Not > My All in One script should help.
Please find an overview of the All in One Script I have been building.
- This is purely for educational purposes.
- This script is not financial advice.
- I hold no responsibility for anyone using this script.
- I do not guarantee lifetime support for this script (if TV update version from 3 to 4, code will need to be updated)
- If you would like to use the script, please message me on TradingView.
- Script One > Give overall direction of trend with
- Script Two > Much Easier to see the Highs and the Lows of the Candles. Easier to Spot Resistance & Support. [Highest High / Lowest Low of Candle/Wick > 20Bars Eitherside)
- Script Three > 1st Confirmation of Pivot High and Low Plot > My 1st Confirmation of High or Low. [Pivot High/Low 20Bars Eitherside > 1st Confirm)
- Script Four > 2nd Confirmation of Pivot High and Low Plot > Entry and Exit > My 2nd Confirmation of High or Low. [Pivot High/Low 10Bars Eitherside > 2nd Confirm)
- Script Five > Plot in the Main Chart Red IF OverBought / Green if OverSold
NOTE > White Support Lines were Manually Drawn. I Drew them from the Script Data. I.e. Looking for Strong Support / Resistance Zones + Possible Fib = Manually Draw and Much Quicker to Make Qualified Decisions on the Probability.

Volume essential parameters overlayVolume EPO – Essential Volume Parameters Overlay
1. Motivation and design philosophy
Volume EPO is designed as a conceptual overlay rather than a self contained trading system. The main idea behind this script is to take complex, foundational market concepts out of heavy, menu driven strategies and express them as lightweight, independent layers that sit on top of any chart or indicator.
In many TradingView scripts, a single strategy tries to handle everything at once: signal logic, risk settings, visual cues, multi timeframe controls, and conceptual explanations. This usually leads to long input menus, performance issues, and difficult maintenance. The architectural approach behind Volume EPO is the opposite: keep the core strategy lean, and move the explanation and measurement of key concepts into dedicated overlays.
In this framework, Volume EPO is the base layer for the concept of volume. It does not decide anything about entries or exits. Instead, it exposes and clarifies how different definitions of volume behave candle by candle. Other layers or strategies can then build on top of this understanding.
2. What Volume EPO does
Volume EPO focuses on four essential volume parameters for each bar:
- Buy volume - Sell volume - Total volume - Delta volume (the difference between buy and sell volume)
The script presents these parameters in a compact heads up display (HUD) table that can be positioned anywhere on the chart. It is designed to be visually minimal, language aware, and usable on top of any other indicator or price action without cluttering the view.
The indicator does not output signals, alerts, arrows, or strategy entries. It is a descriptive and educational tool that shows how volume is distributed, not a prescriptive tool that tells the trader what to do.
3. Two definitions of volume
A central theme of this script is that there is more than one way to define and interpret “volume” inside a single candle. Volume EPO implements and clearly separates two different approaches:
- A geometric, candle based approximation that uses only OHLC and volume of the current bar. - An intrabar, data driven definition that uses lower timeframe up and down volume when it is available.
The user can switch between these modes via the calculation method input. The mode is prominently shown inside the on chart table so that the context is always explicit.
3.1 Geometry mode (Source File, approximate)
In Geometry mode, Volume EPO works only with the current bar’s OHLC values and total volume. No lower timeframe data is required.
The candle’s range is defined as high minus low. If the range is positive, the position of the close inside that range is used as a simple model for how volume might have been distributed between buyers and sellers:
- The closer the close is to the high, the more of the total volume is attributed to the buying side. - The closer the close is to the low, the more of the total volume is attributed to the selling side. - In a rare case where the bar has no price range (for example a flat or doji bar), total volume is split evenly between buy and sell volume.
From this model, the script derives:
- Buy volume (approximated) - Sell volume (approximated) - Total volume (as reported by the bar) - Delta volume as the difference between buy and sell volume
This approach is intentionally labeled as “Geometry (Approx)” in the HUD. It is a theoretical reconstruction based solely on the candle’s geometry and total volume, and it is always available on any market or timeframe that provides OHLCV data.
3.2 Intrabar mode (Precise)
In Intrabar mode, Volume EPO uses the TradingView built in library for up and down volume on a user selected lower timeframe. Instead of inferring volume from the shape of the candle, it reads the underlying lower timeframe data when that data is accessible.
The script requests up and down volume from a lower timeframe such as 15 seconds, using the official TA library functions. The results are then interpreted as follows:
- Buy volume is taken as the absolute value of the up volume. - Sell volume is taken as the absolute value of the down volume. - Total volume is the sum of buy and sell volume. - Delta volume is provided directly by the library as the difference between up and down volume.
If valid lower timeframe data exists for a bar, the bar is counted as covered by Intrabar data. If not, that bar is marked as invalid for this precise calculation and is excluded from the covered count.
This mode is labeled “Precise” in the HUD, together with the selected lower timeframe, because it is anchored in actual intrabar data rather than in a geometric model. It provides a closer view of how buying and selling pressure unfolded inside the bar, at the cost of requiring more data and being dependent on the availability of that data.
4. Coverage, lookback, and what the numbers mean
The top part of the HUD reports not only which volume definition is active, but also an additional line that describes the effective coverage of the data.
In Intrabar (Precise) mode, the script displays:
- “Scanned: N Bars”
Here, N counts how many bars since the indicator was loaded have successfully received valid lower timeframe delta data. It is a measure of how much of the visible history has been truly covered by intrabar information, not a lookback window in the sense of a rolling calculation.
In Geometry mode, the script displays:
- “Lookback: L Bars”
In this extracted layer, the lookback value L is purely descriptive. It does not change how the current bar’s volume is computed, and it is not used in any iterative or statistical calculation inside this script. It is meant as a conceptual label, for example to keep the volume layer consistent with a broader framework where lookback length is a structural parameter.
Summarizing these two fields:
- Scanned tells you how many bars have been processed using real intrabar data. - Lookback is a descriptive parameter in Geometry mode in this specific overlay, not a direct driver of the computations.
5. The HUD layout on the chart
The on chart table is intentionally compact and structured to be read quickly:
- Header: a title identifying the overlay as Volume EPO. - Mode line: explicitly states whether the script is in Precise or Geometry mode, and for Precise mode also shows the lower timeframe used. - Coverage line: - In Precise mode, it shows “Scanned: N Bars”. - In Geometry mode, it shows “Lookback: L Bars”. - Volume block: - A line for buy and sell volume, marked with clear directional symbols. - A line for total volume and the absolute delta, accompanied by the sign of the delta. - Numeric formatting uses human friendly suffixes (for example K, M, B) to keep the display readable. - Footer: the current symbol and a time stamp, adjusted by a user selectable timezone offset so that the HUD can be aligned with the trader’s local time reference.
The table can be positioned anywhere on the chart and resized via inputs, and it supports multiple color themes and languages in order to integrate cleanly into different chart layouts.
6. How to use Volume EPO in practice
Volume EPO is meant to be read together with price action and other tools, not in isolation. Typical uses include:
- Studying how often a strong directional candle is actually supported by dominant buy or sell volume. - Comparing the behavior of delta volume between Geometry and Intrabar definitions. - Building a personal intuition for how intrabar data refines or contradicts the simple candle based approximation. - Feeding these insights into separate, lean strategy scripts that do not need to carry the full explanatory logic of volume inside them.
Because it is an overlay layer, Volume EPO can be stacked with other custom indicators without adding new signals or complexity to their logic. It simply adds a clear and consistent view of volume behavior on top of whatever the trader is already watching.
7. Educational and non signalling nature
Finally, it is important to stress that Volume EPO is not a trading system, not a signal generator, and not financial advice. The script does not tell the user when to enter or exit. It only reports how different definitions of volume describe the current bar.
Deciding whether to trade, how to trade, and which risk parameters to use remains entirely with the user and with their own strategy. Volume EPO provides context and clarity around the concept of volume so that those decisions can be informed by a better understanding of how buying and selling pressure is structured inside each candle.
Note: Even on lower timeframes, every reconstruction of volume remains an approximation, except at the true single tick level. However, the closer the chosen lower timeframe is to a one tick stream, the more accurately it can reflect the underlying order flow and balance between buying and selling pressure.

FiniteStateMachine🟩 OVERVIEW
A flexible framework for creating, testing and implementing a Finite State Machine (FSM) in your script. FSMs use rules to control how states change in response to events.
This is the first Finite State Machine library on TradingView and it's quite a different way to think about your script's logic. Advantages of using this vs hardcoding all your logic include:
• Explicit logic : You can see all rules easily side-by-side.
• Validation : Tables show your rules and validation results right on the chart.
• Dual approach : Simple matrix for straightforward transitions; map implementation for concurrent scenarios. You can combine them for complex needs.
• Type safety : Shows how to use enums for robustness while maintaining string compatibility.
• Real-world examples : Includes both conceptual (traffic lights) and practical (trading strategy) demonstrations.
• Priority control : Explicit control over which rules take precedence when multiple conditions are met.
• Wildcard system : Flexible pattern matching for states and events.
The library seems complex, but it's not really. Your conditions, events, and their potential interactions are complex. The FSM makes them all explicit, which is some work. However, like all "good" pain in life, this is front-loaded, and *saves* pain later, in the form of unintended interactions and bugs that are very hard to find and fix.
🟩 SIMPLE FSM (MATRIX-BASED)
The simple FSM uses a matrix to define transition rules with the structure: state > event > state. We look up the current state, check if the event in that row matches, and if it does, output the resulting state.
Each row in the matrix defines one rule, and the first matching row, counting from the top down, is applied.
A limitation of this method is that you can supply only ONE event.
You can design layered rules using widlcards. Use an empty string "" or the special string "ANY" for any state or event wildcard.
The matrix FSM is foruse where you have clear, sequential state transitions triggered by single events. Think traffic lights, or any logic where only one thing can happen at a time.
The demo for this FSM is of traffic lights.
🟩 CONCURRENT FSM (MAP-BASED)
The map FSM uses a more complex structure where each state is a key in the map, and its value is an array of event rules. Each rule maps a named condition to an output (event or next state).
This FSM can handle multiple conditions simultaneously. Rules added first have higher priority.
Adding more rules to existing states combines the entries in the map (if you use the supplied helper function) rather than overwriting them.
This FSM is for more complex scenarios where multiple conditions can be true simultaneously, and you need to control which takes precedence. Like trading strategies, or any system with concurrent conditions.
The demo for this FSM is a trading strategy.
🟩 HOW TO USE
Pine Script libraries contain reusable code for importing into indicators. You do not need to copy any code out of here. Just import the library and call the function you want.
For example, for version 1 of this library, import it like this:
import SimpleCryptoLife/FiniteStateMachine/1
See the EXAMPLE USAGE sections within the library for examples of calling the functions.
For more information on libraries and incorporating them into your scripts, see the Libraries section of the Pine Script User Manual.
🟩 TECHNICAL IMPLEMENTATION
Both FSM implementations support wildcards using blank strings "" or the special string "ANY". Wildcards match in this priority order:
• Exact state + exact event match
• Exact state + empty event (event wildcard)
• Empty state + exact event (state wildcard)
• Empty state + empty event (full wildcard)
When multiple rules match the same state + event combination, the FIRST rule encountered takes priority. In the matrix FSM, this means row order determines priority. In the map FSM, it's the order you add rules to each state.
The library uses user-defined types for the map FSM:
• o_eventRule : Maps a condition name to an output
• o_eventRuleWrapper : Wraps an array of rules (since maps can't contain arrays directly)
Everything uses strings for maximum library compatibility, though the examples show how to use enums for type safety by converting them to strings.
Unlike normal maps where adding a duplicate key overwrites the value, this library's `m_addRuleToEventMap()` method *combines* rules, making it intuitive to build rule sets without breaking them.
🟩 VALIDATION & ERROR HANDLING
The library includes comprehensive validation functions that catch common FSM design errors:
Error detection:
• Empty next states
• Invalid states not in the states array
• Duplicate rules
• Conflicting transitions
• Unreachable states (no entry/exit rules)
Warning detection:
• Redundant wildcards
• Empty states/events (potential unintended wildcards)
• Duplicate conditions within states
You can display validation results in tables on the chart, with tooltips providing detailed explanations. The helper functions to display the tables are exported so you can call them from your own script.
🟩 PRACTICAL EXAMPLES
The library includes four comprehensive demos:
Traffic Light Demo (Simple FSM) : Uses the matrix FSM to cycle through traffic light states (red → red+amber → green → amber → red) with timer events. Includes pseudo-random "break" events and repair logic to demonstrate wildcards and priority handling.
Trading Strategy Demo (Concurrent FSM) : Implements a realistic long-only trading strategy using BOTH FSM types:
• Map FSM converts multiple technical conditions (EMA crosses, gaps, fractals, RSI) into prioritised events
• Matrix FSM handles state transitions (idle → setup → entry → position → exit → re-entry)
• Includes position management, stop losses, and re-entry logic
Error Demonstrations : Both FSM types include error demos with intentionally malformed rules to showcase the validation system's capabilities.
🟩 BRING ON THE FUNCTIONS
f_printFSMMatrix(_mat_rules, _a_states, _tablePosition)
Prints a table of states and rules to the specified position on the chart. Works only with the matrix-based FSM.
Parameters:
_mat_rules (matrix)
_a_states (array)
_tablePosition (simple string)
Returns: The table of states and rules.
method m_loadMatrixRulesFromText(_mat_rules, _rulesText)
Loads rules into a rules matrix from a multiline string where each line is of the form "current state | event | next state" (ignores empty lines and trims whitespace).
This is the most human-readable way to define rules because it's a visually aligned, table-like format.
Namespace types: matrix
Parameters:
_mat_rules (matrix)
_rulesText (string)
Returns: No explicit return. The matrix is modified as a side-effect.
method m_addRuleToMatrix(_mat_rules, _currentState, _event, _nextState)
Adds a single rule to the rules matrix. This can also be quite readble if you use short variable names and careful spacing.
Namespace types: matrix
Parameters:
_mat_rules (matrix)
_currentState (string)
_event (string)
_nextState (string)
Returns: No explicit return. The matrix is modified as a side-effect.
method m_validateRulesMatrix(_mat_rules, _a_states, _showTable, _tablePosition)
Validates a rules matrix and a states array to check that they are well formed. Works only with the matrix-based FSM.
Checks: matrix has exactly 3 columns; no empty next states; all states defined in array; no duplicate states; no duplicate rules; all states have entry/exit rules; no conflicting transitions; no redundant wildcards. To avoid slowing down the script unnecessarily, call this method once (perhaps using `barstate.isfirst`), when the rules and states are ready.
Namespace types: matrix
Parameters:
_mat_rules (matrix)
_a_states (array)
_showTable (bool)
_tablePosition (simple string)
Returns: `true` if the rules and states are valid; `false` if errors or warnings exist.
method m_getStateFromMatrix(_mat_rules, _currentState, _event, _strictInput, _strictTransitions)
Returns the next state based on the current state and event, or `na` if no matching transition is found. Empty (not na) entries are treated as wildcards if `strictInput` is false.
Priority: exact match > event wildcard > state wildcard > full wildcard.
Namespace types: matrix
Parameters:
_mat_rules (matrix)
_currentState (string)
_event (string)
_strictInput (bool)
_strictTransitions (bool)
Returns: The next state or `na`.
method m_addRuleToEventMap(_map_eventRules, _state, _condName, _output)
Adds a single event rule to the event rules map. If the state key already exists, appends the new rule to the existing array (if different). If the state key doesn't exist, creates a new entry.
Namespace types: map
Parameters:
_map_eventRules (map)
_state (string)
_condName (string)
_output (string)
Returns: No explicit return. The map is modified as a side-effect.
method m_addEventRulesToMapFromText(_map_eventRules, _configText)
Loads event rules from a multiline text string into a map structure.
Format: "state | condName > output | condName > output | ..." . Pairs are ordered by priority. You can have multiple rules on the same line for one state.
Supports wildcards: Use an empty string ("") or the special string "ANY" for state or condName to create wildcard rules.
Examples: " | condName > output" (state wildcard), "state | > output" (condition wildcard), " | > output" (full wildcard).
Splits lines by \n, extracts state as key, creates/appends to array with new o_eventRule(condName, output).
Call once, e.g., on barstate.isfirst for best performance.
Namespace types: map
Parameters:
_map_eventRules (map)
_configText (string)
Returns: No explicit return. The map is modified as a side-effect.
f_printFSMMap(_map_eventRules, _a_states, _tablePosition)
Prints a table of map-based event rules to the specified position on the chart.
Parameters:
_map_eventRules (map)
_a_states (array)
_tablePosition (simple string)
Returns: The table of map-based event rules.
method m_validateEventRulesMap(_map_eventRules, _a_states, _a_validEvents, _showTable, _tablePosition)
Validates an event rules map to check that it's well formed.
Checks: map is not empty; wrappers contain non-empty arrays; no duplicate condition names per state; no empty fields in o_eventRule objects; optionally validates outputs against matrix events.
NOTE: Both "" and "ANY" are treated identically as wildcards for both states and conditions.
To avoid slowing down the script unnecessarily, call this method once (perhaps using `barstate.isfirst`), when the map is ready.
Namespace types: map
Parameters:
_map_eventRules (map)
_a_states (array)
_a_validEvents (array)
_showTable (bool)
_tablePosition (simple string)
Returns: `true` if the event rules map is valid; `false` if errors or warnings exist.
method m_getEventFromConditionsMap(_currentState, _a_activeConditions, _map_eventRules)
Returns a single event or state string based on the current state and active conditions.
Uses a map of event rules where rules are pre-sorted by implicit priority via load order.
Supports wildcards using empty string ("") or "ANY" for flexible rule matching.
Priority: exact match > condition wildcard > state wildcard > full wildcard.
Namespace types: series string, simple string, input string, const string
Parameters:
_currentState (string)
_a_activeConditions (array)
_map_eventRules (map)
Returns: The output string (event or state) for the first matching condition, or na if no match found.
o_eventRule
o_eventRule defines a condition-to-output mapping for the concurrent FSM.
Fields:
condName (series string) : The name of the condition to check.
output (series string) : The output (event or state) when the condition is true.
o_eventRuleWrapper
o_eventRuleWrapper wraps an array of o_eventRule for use as map values (maps cannot contain collections directly).
Fields:
a_rules (array) : Array of o_eventRule objects for a specific state.

Price Action Key Level Break & Retest — Instant ReversalThis script identifies high-confidence support and resistance levels using pivot points and multi-step retest confirmation. It helps traders detect reliable breakout and reversal zones using price action.
How It Works:
1. The script scans for pivot highs and lows on the chart to identify potential key levels.
2. Each level is monitored for multiple retests (configurable by the user). The more a level is tested and holds, the stronger it becomes.
3. When price interacts with a key level:
o A Support signal occurs if the level acts as support after multiple retests.
o A Resistance signal occurs if the level acts as resistance after multiple retests.
o If a signal fails (price breaks the level), an opposite signal is automatically placed at the breach point.
4. Optional volume filter validates the strength of moves, reducing false signals.
5. Horizontal Line Visualization: Support and Resistance signals are represented by drawing manually horizontal lines, which remain on the chart regardless of scrolling, zooming, or candle compression and helps traders to identify the breakout of key levels
Example:
• Suppose a stock forms a pivot low at ₹1,000.
• Price retraces and touches ₹1,000 two to three times, holding each time — the level is confirmed as strong support.
• The script places a buy line at ₹1,000.
• If price breaks below ₹1,000 after holding it for multiple retests, the script automatically generates a Resistance Signal at the breach point, signaling a potential trend reversal.
• That Resistance Signal act as Resistance level throughout. if such Resistance level breaks out above, it act as Support level and vice versa
• This allows traders to react adaptively, entering trades based on confirmed support or resistance while managing risk.
Why It’s Useful:
• Focuses on multi-retest confirmation rather than single touch points, reducing false signals.
• To draw horizontal lines on key levels, providing clear visualization of key levels without clutter.
• Integrates adaptive breach signals, so traders can respond when levels fail.
• Suitable for swing, intraday, and trend-following strategies.
How to Use:
1. Apply the script to any timeframe.
2. Configure pivot detection length and maximum retests to match trading style.
3. Enable the optional volume filter for stronger signal validation.
4. Monitor the horizontal lines for Support/Resistance signals and opposite signals at breaches.
5. Combine with other technical analysis if desired.
Concepts Behind the Script:
• Pivot-based support and resistance
• Multi-retest validation for stronger levels
• Adaptive opposite signals for failed levels
• Volume-based confirmation for reliability
• Horizontal line visualization for easy tracking
Key Features:
Horizontal Lines visualization: Support and Resistance levels remain on the chart permanently, providing constant visual reference.
Multi-Timeframe Compatible: Can be applied on any timeframe; lines and breach logic adjust automatically.
Optional Noise Filters: Volume and retest filters improve signal reliability.
Why It’s Worth Paying:
• Uses multi-retest confirmation to reduce false signals compared to standard support/resistance scripts.
• Provides adaptive opposite signals for failed levels — giving traders an actionable edge.
• Visualizes key levels as fixed horizontal lines, helping traders track trends clearly.
• Works across multiple timeframes — suitable for intraday, swing, or trend-following strategies.
How to Request Access:
This script is invite-only on TradingView. To get access:
1. DM me on TradingView with your username.
2. Access is granted individually to ensure proper use and avoid unauthorized sharing.
3. Once approved, you can apply the script to your charts immediately and benefit from high-confidence level detection.
Disclaimer:
Trading involves risk. Signals are based on historical price action and should be used alongside other technical analysis and risk management strategies.
Past performance does not guarantee future results. This is an analytical tool; it does not provide investment advice.

Multi-Timeframe Continuity Custom Candle ConfirmationMulti-Timeframe Continuity Custom Candle Confirmation
Overview
The Timeframe Continuity Indicator is a versatile tool designed to help traders identify alignment between their current chart’s candlestick direction and higher timeframes of their choice. By coloring bars on the current chart (e.g., 1-minute) based on the directional alignment with selected higher timeframes (e.g., 10-minute, daily), this indicator provides a visual cue for confirming trends across multiple timeframes—a concept known as Timeframe Continuity. This approach is particularly useful for day traders, swing traders, and scalpers looking to ensure their trades align with broader market trends, reducing the risk of trading against the prevailing momentum.
Originality and Usefulness
This indicator is an original creation, built from scratch to address a common challenge in trading: ensuring that price action on a lower timeframe aligns with the trend on higher timeframes. Unlike many trend-following indicators that rely on moving averages, oscillators, or other lagging metrics, this script directly compares the bullish or bearish direction of candlesticks across timeframes. It introduces the following unique features:
Customizable Timeframes: Users can select from a range of higher timeframes (5m, 10m, 15m, 30m, 1h, 2h, 4h, 1d, 1w, 1M) to check for alignment, making it adaptable to various trading styles.
Neutral Candle Handling: The script accounts for neutral candles (where close == open) on the current timeframe by allowing them to inherit the direction of the higher timeframe, ensuring continuity in trend visualization.
Table: A table displays the direction of each selected timeframe and the current timeframe, helping identify direction in the event you don't want to color bars.
Toggles for Flexibility: Options to disable bar coloring and the debug table allow users to customize the indicator’s visual output for cleaner charts or focused analysis.
This indicator is not a mashup of existing scripts but a purpose-built tool to visualize timeframe alignment directly through candlestick direction, offering traders a straightforward way to confirm trend consistency.
What It Does
The Timeframe Continuity Indicator colors bars on your chart when the direction of the current timeframe’s candlestick (bullish, bearish, or neutral) aligns with the direction of the selected higher timeframes:
Lime: The current bar (e.g., 1m) is bullish or neutral, and all selected higher timeframes (e.g., 10m) are bullish.
Pink: The current bar is bearish or neutral, and all selected higher timeframes are bearish.
Default Color: If the directions don’t align (e.g., 1m bar is bearish but 10m is bullish), the bar remains the default chart color.
The indicator also includes a debug table (toggleable) that shows the direction of each selected timeframe and the current timeframe, helping traders diagnose alignment issues.
How It Works
The script uses the following methodology:
1. Direction Calculation: For each timeframe (current and selected higher timeframes), the script determines the candlestick’s direction:
Bullish (1): close > open / Bearish (-1): close < open / Neutral (0): close == open
Higher timeframe directions are fetched using Pine Script’s request.security function, ensuring accurate data retrieval.
2. Alignment Check: The script checks if all selected higher timeframes are uniformly bullish (full_bullish) or bearish (full_bearish).
o A higher timeframe must have a clear direction (bullish or bearish) to trigger coloring. If any selected timeframe is neutral, alignment fails, and no coloring occurs.
3. Coloring Logic: The current bar is colored only if its direction aligns with the higher timeframes:
Lime if the higher timeframes are bullish and the current bar is bullish or neutral.
Maroon if the higher timeframes are bearish and the current bar is bearish or neutral.
If the current bar’s direction opposes the higher timeframe (e.g., 1m bearish, 10m bullish), the bar remains uncolored.
Users can disable bar coloring entirely via the settings, leaving bars in their default chart color.
4. Direction Table:
A table in the top-right corner (toggleable) displays the direction of each selected timeframe and the current timeframe, using color-coded labels (green for bullish, red for bearish, gray for neutral).
This feature helps traders understand why a bar is or isn’t colored, making the indicator accessible to users unfamiliar with Pine Script.
How to Use
1. Add the Indicator: Add the "Timeframe Continuity Indicator" to your chart in TradingView (e.g., a 1m chart of SPY).
2. Configure Settings:
Timeframe Selection: Check the boxes for the higher timeframes you want to compare against (default: 10m). Options include 5m, 10m, 15m, 30m, 1h, 2h, 4h, 1D, 1W, and 1M. Select multiple timeframes if you want to ensure alignment across all of them (e.g., 10m and 1d).
Enable Bar Coloring: Default: true (bars are colored lime or maroon when aligned). Set to false to disable coloring and keep the default chart colors.
Show Table: Default: true (table is displayed in the top-right corner). Set to false to hide the table for a cleaner chart.
3. Interpret the Output:
Colored Bars: Lime bars indicate the current bar (e.g., 1m) is bullish or neutral, and all selected higher timeframes are bullish. Maroon bars indicate the current bar is bearish or neutral, and all selected higher timeframes are bearish. Uncolored bars (default chart color) indicate a mismatch (e.g., 1m bar is bearish while 10m is bullish) or no coloring if disabled.
Direction Table: Check the table to see the direction of each selected timeframe and the current timeframe.
4. Example Use Case:
On a 1m chart of SPY, select the 10m timeframe.
If the 10m timeframe is bearish, 1m bars that are bearish or neutral will color maroon, confirming you’re trading with the higher timeframe’s trend.
If a 1m bar is bullish while the 10m is bearish, it remains uncolored, signaling a potential misalignment to avoid trading.
Underlying Concepts
The indicator is based on the concept of Timeframe Continuity, a strategy used by traders to ensure that price action on a lower timeframe aligns with the trend on higher timeframes. This reduces the risk of entering trades against the broader market direction. The script directly compares candlestick directions (bullish, bearish, or neutral) rather than relying on lagging indicators like moving averages or RSI, providing a real-time, price-action-based confirmation of trend alignment. The handling of neutral candles ensures that minor indecision on the lower timeframe doesn’t interrupt the visualization of the higher timeframe’s trend.
Why This Indicator?
Simplicity: Directly compares candlestick directions, avoiding complex calculations or lagging indicators.
Flexibility: Customizable timeframes and toggles cater to various trading strategies.
Transparency: The debug table makes the indicator’s logic accessible to all users, not just those who can read Pine Script.
Practicality: Helps traders confirm trend alignment, a key factor in successful trading across timeframes.

Uptrick: Oscillator SpectrumUptrick: Oscillator Spectrum is a versatile trading tool designed to bring together multiple aspects of technical analysis—oscillators, momentum signals, divergence checks, correlation insights, and more—into one script. It includes customizable overlays and alert conditions intended to address a wide range of market conditions and trading styles.
Developed in Pine Script™, Uptrick: Oscillator Spectrum represents an extended version of the classic Ultimate Oscillator concept. It consolidates short-, medium-, and long-term momentum readings, applies correlation analysis across different symbols, and offers optional table-based metrics to provide traders with a more structured overview of potential trade setups. Whether used alongside your existing charts or as a standalone toolkit, it aims to build on and enhance the functionality of the standard Ultimate Oscillator.
### A Few Key Features
- Momentum Insights: Multiple timeframes for oscillators, plus buy/sell signal modes for flexible identification of overbought/oversold situations or crossovers.
- Divergence Detection: Automated checks for bullish/bearish divergences, aiming to help traders spot potential shifts in momentum.
- Correlation Meter: A visual histogram summarizing how selected assets are collectively trending. It is useful for tracking the bigger market picture.
- Gradient Overlays & Bar Coloring: Dynamic color transitions designed to emphasize changes in momentum, trend shifts, and overall sentiment without cluttering the chart.
- Money Flow Tracker: Tracks the flow of money into and out of the market using a smoothed Money Flow Index (MFI). Highlights overbought/oversold conditions with dynamic bar coloring and visual gradient fills, helping traders assess volume-driven sentiment shifts.
- Advanced Table Metrics: An optional table showing return on investment (ROI), collateral risk, and other contextual metrics for supported assets.
- Alerts & Automation: Configurable alerts covering divergence events, crossing of critical levels, and more, helping to keep traders informed of developments in real time.
### Intended Usage
- For Multiple Markets: Works on various markets (cryptocurrencies, forex pairs, stocks) to deliver a consistent view of momentum, potential entry/exit signals, and correlation.
- Adaptable Trading Styles: With customizable input settings, you can enable or disable specific features to align with your preferred strategies—intraday scalping, swing trading, or position holding.
By combining these elements under one indicator, Uptrick: Oscillator Spectrum allows traders to streamline analysis workflows, helping them stay focused on interpreting market moves and making informed decisions rather than juggling multiple scripts.
Purpose
Purpose of the “Uptrick: Oscillator Spectrum” Indicator
The “Uptrick: Oscillator Spectrum” indicator is intended to bring together several technical analysis elements into one tool. It combines oscillator-based momentum readings across different lookback periods, checks for potential divergences, provides optional buy/sell signal triggers, and offers correlation-based insights across multiple symbols. Additionally, it includes features such as bar coloring, gradient visualization, and user-configurable alerts to help highlight various market conditions.
By consolidating these functions, the script aims to help users systematically observe changing momentum, identify when prices reach user-defined overbought or oversold levels, detect when oscillator movements diverge from price, and examine whether different assets are aligning or diverging in their trends. The indicator also allows for optional advanced metric tables, which can supply further context on risk, ROI calculations, or other factors for supported assets. Overall, the script’s purpose is to organize multiple layers of technical analysis so that users have a structured way to evaluate potential trade opportunities and market behavior.
## Usage Guide
Below is an outline of how you can utilize the various components and features of Uptrick: Oscillator Spectrum in your charting workflow.
---
### 1. Using the Core Oscillator
- Basic View: By default, the script calculates a multi-timeframe oscillator (commonly displayed as the “Ultimate Oscillator”). This oscillator combines short-, medium-, and long-term measurements of buying pressure and true range.
- Overbought/Oversold Zones: You can configure thresholds (e.g., 70 for overbought, 30 for oversold) to help identify potential turning points. When the oscillator crosses these levels, it may indicate that price is extended in one direction.
- You can use the colors of the main oscillator to help you take short-term trades as well: cyan : Buy , red: Sell
- Alerts: If you enable alerts, the indicator can notify you when the oscillator crosses above or below your chosen overbought/oversold boundaries or when you get buy/sell signals.
---
### 2. Buy/Sell Signals in Overlay Modes
Uptrick: Oscillator Spectrum provides several signal modes and a choice between overlay true and overlay false or both. Additionally, you can pick which “line” (data source) the script uses to generate signals. This is set in the “Line to Analyze” dropdown, which includes Oscillator, HMA of Oscillator, and Moving Average. The following sections describe how each piece fits together.
---
#### Line to Analyze - Overlay Flase: Oscillator / HMA of Oscillator / Moving Average
1. Oscillator
- The core momentum reading, reflecting short-, medium-, and long-term periods combined.
2. HMA of Oscillator
- Applies a Hull Moving Average to the oscillator, creating a smoother but still responsive curve.
- Signals will be derived from this smoothed line. Some traders find it filters out minor fluctuations while remaining quicker to react than standard averages.
3. Moving Average
- Uses a user-selected MA type (SMA, EMA, WMA, etc.) over the oscillator values, rather than the raw oscillator itself.
- Tends to be more stable than the raw oscillator, but might delay signals more depending on the chosen MA settings.
---
#### Signal Modes
Regardless of which line you choose to analyze, you can use one of the following seven signal modes in overlay being true:
1. Overbought/Oversold (Pyramiding)
- What It Does:
- Buy signal when the chosen line crosses below the oversold threshold.
- Sell signal when it crosses above the overbought threshold.
- Pyramiding:
- Allows multiple triggers within the same overbought/oversold event.
2. Overbought/Oversold (Non Pyramiding)
- What It Does:
- Same thresholds but only one signal per oversold or overbought event.
- Use Case:
- Prevents repeated signals and chart clutter.
3. Smoothed MA Middle Crossover
- What It Does:
- Uses an MA defined by the user.
- Buy when crossing above the midpoint (50), Sell when crossing below.
- Use Case:
- Generates fewer signals, focusing on broader momentum shifts. There is no pyramiding.
In this image ,for example, the VWMA is used with length of 14 to identify buy sell signals.
4. Crossing Above Overbought/Below Oversold (Non Pyramiding)
- What It Does:
- Buy occurs if the line exits oversold territory by crossing back above it.
- Sell occurs if the line exits overbought territory by crossing back below it.
- Non Pyramiding:
- Restricts repeated signals until conditions reset.
5. Crossing Above Overbought/Below Oversold (Pyramiding)
- What It Does:
- Same thresholds, but allows multiple signals if the line repeatedly dips in and out of overbought or oversold.
- Use Case:
- More frequent entries/exits for active traders.
6. Divergence (Non Pyramiding)
- What It Does:
- Identifies bullish or bearish divergences using the chosen line vs. price.
- Buy for bullish divergence (higher low on the line vs. lower low on price), Sell for bearish divergence.
- Single Trigger:
- Only one signal per identified divergence event. (non pyramiding)
7. Divergence (Pyramiding)
- What It Does:
- Same divergence logic but triggers multiple times if the script sees repeated divergence in the same direction.
- Use Case:
- Could suit traders who layer positions during sustained divergence scenarios.
#### Overlay Modes: True vs. False
1. Overlay True
- Buy/sell arrows or labels plot directly on the main price chart, often at or near candlesticks.
- Bar Coloring:
- Can turn the candlestick bars green (buy) or red (sell), with intensity reflecting signal recency if bar coloring is enabled for this mode. (read below.)
- Advantage:
- Everything (price, signals, bar colors) is in one spot, making it straightforward to associate signals with current market action. You can adjust the periods of the main oscillator or lookback periods of divergences or overbought/oversold thresholds, to play around with your signals.
2. Overlay False
- Signal Placement:
- Signals appear in a sub-window or oscillator panel, leaving the main price chart uncluttered.
- Bar Coloring:
- You may still enable bar colors on the main chart (green for buy, red for sell) if desired.
- Alternatively, you can keep them neutral if you prefer a completely separate display of signals.
- Advantage:
- Clear separation of price action from signals, useful for cleaner charts or if using multiple overlay-based tools.
At the bottom are the signals for overlay being false and on the chart are the signals for overlay being true:
#### Bar Color Adjustments
1. Coloring Logic
- Bars typically go green on buy signals, red on sell signals.
- The opacity or brightness can vary to indicate signal freshness. When a new signal is formed, the color gets brighter. When there is no signal for a longer period of time, then the color slowly fades.
2. Enabling Bar Coloring
- In the indicator’s settings, turn on Bar Coloring.
- Choose “Signals Overlay True” or “Signals Overlay False” from the “Color should depend on:” dropdown, depending on which overlay approach you want to drive your bar colors. You can also chose the cloud fill in overlay false, correlation meter and smoothed HMA to color bars. Read more below:
### Bar Color Options:
When you enable bar coloring in Uptrick: Oscillator Spectrum, you can select which component or signal logic drives the color changes. Below are the five available choices:
---
#### Option 1: Overlay True Signals
- What It Does:
- Uses signals generated under the Overlay True mode to color the bars on your main chart.
- If a buy signal is triggered, bars turn green. If a sell signal occurs, bars turn red.
- Color Intensity:
- Bars appear brighter (more opaque) immediately after a new signal fires, then gradually fade over subsequent bars if no new signal appears.
---
#### Option 2: Overlay False Signals
- What It Does:
- Links bar coloring to signals generated when Overlay False mode is active.
- Buy/sell labels typically plot in a separate sub-window instead of the main chart, but your price bars can still change color based on these signals.
- Color Intensity:
- Similar to Overlay True, new buy/sell signals yield stronger color intensity, which fades over time.
- Use Case:
- Helps maintain a clean main chart (with signals off-chart) while still providing an immediate color-coded indication of a buy or sell state.
- Particularly useful if you prefer less clutter from signal markers on your price chart yet still want a visual representation of signal timing.
In this example normal divergence Pyramiding Signals are used in the overlay being true and the signals in overlay false are signals that analyze the HMA. This can help clear out noise (using a combo of both).
Option 3: Money Flow Tracker
What It Does:
The Money Flow Tracker uses the Money Flow Index (MFI), a volume-weighted oscillator, to measure the strength of money flowing into or out of an asset. The script smooths the raw MFI data using an EMA for a more responsive and visually intuitive output.
The feature also includes dynamic color gradients and bar coloring that highlight whether money flow is positive or negative.
Green Fill/Bar Color: Indicates positive money flow, suggesting potential accumulation.
Red Fill/Bar Color: Indicates negative money flow, signaling potential distribution.
Overbought and oversold thresholds are dynamically emphasized with transparency, making it easier to identify high-confidence zones.
Use Case:
Ideal for traders focusing on volume-driven sentiment to identify turning points or confirm existing trends.
Suitable for assessing broader market conditions when used alongside other indicators like oscillators or correlation analysis.
Provides additional clarity in spotting areas of accumulation or distribution, making it a valuable complement to price action and momentum studies.
---
#### Option 4: Correlation Meter
- What It Does:
- Colors the bars based on the indicator’s Correlation Meter output. The script checks multiple chosen tickers and sums up how many are trending positively or negatively.
- If the meter indicates an overall bullish bias (e.g., more than three assets in uptrend), bars turn green; if it’s bearish, bars turn red.
- Trend Readings:
- The correlation meter typically plots a histogram of bullish/neutral/bearish states. The bar color option links your chart’s candlestick coloring to that higher-level market sentiment.
- Use Case:
- Useful for traders wanting a quick visual prompt of whether the broader market (or a selection of related assets) is bullish or bearish at any given time.
- Helps avoid signals that conflict with the market majority.
#### Option 5: Smoothed HMA
- What It Does:
- Bar colors are driven by the slope or state of the Hull Moving Average (HMA) of the oscillator, rather than individual buy/sell triggers or correlation data.
- If the HMA indicates a strong upward slope (possibly darkening), bars may turn green; if the slope is downward (purple in the HMA line), bars turn red.
- Use Case:
- Ideal for those who focus on momentum continuity rather than discrete signals like overbought/oversold or divergence.
- May help identify smoother, more sustained moves, as the HMA filters out minor oscillations.
---
### 3. Using the Hull Moving Average (HMA) of the Oscillator
- HMA Calculation: You can enable a dedicated Hull Moving Average (HMA) for the oscillator. This creates a smoother line of the same underlying momentum reading, typically responding more quickly than classic moving averages.
- Color Intensity: As the HMA sustains an uptrend or downtrend, the script can adjust the line’s color. When slope momentum persists in one direction, the color appears more opaque. This intensification can hint that the existing direction may be well-established.
- Reversal Potential: If you observe the HMA color shifting or darkening after multiple bars of slope in the same direction, it may indicate increasing momentum. Conversely, a sudden flattening or change in color can be a clue that momentum is waning.
---
### 4. Moving Average Overlays & Gradient Cloud
- Oscillator MA: The script allows you to apply moving average types (SMA, EMA, SMMA, WMA, or VWMA) to the core oscillator, rather than to price. This can smooth out noise in the oscillator, potentially highlighting more consistent momentum shifts.
- Gradient Cloud: You can also enable a cloud in overlay true between two moving averages (for instance, a Hull MA and a Double EMA) on the price chart. The cloud fills with different colors, depending on which MA is above the other. This can provide a quick visual reference to bullish or bearish areas.
---
### 5. Divergence Detection
- Bullish & Bearish Divergence: By toggling “Calculate Divergence,” the script looks for oscillator pivots that contrast with price pivots (e.g., price making a lower low while the oscillator makes a higher low).
- A divergence is when the price makes an opposite pivot to the indicator value. E.g. Price makes lower low but indicator does higher low - This suggests a bullish divergence. THe opposite is for a bearish divergence.
- Visual Labels: When a divergence is found, labels (such as “Bull” or “Bear”) appear on the oscillator. This helps you see if the oscillator’s momentum patterns differ from the price movement.
- Filtering Signals: You can combine divergence signals with other features like overbought/oversold or the HMA slope to refine potential entries or exits.
---
### 6. Correlation & Multi-Ticker Analysis
- Correlation Meter: You can select up to five tickers in the settings. The script calculates a slope-based metric for each, then combines those metrics to show an overall bullish or bearish tendency (displayed as a histogram).
- Bar Coloring & Overlay: If you activate correlation-based bar coloring, it will reflect the broader trend alignment among the selected assets, potentially indicating when most are trending in the same direction.
- Use Case: If you trade multiple markets, the correlation histogram can help you quickly see if several major assets support the same market bias or are diverging from one another.
—
### 7. Money Flow Tracker
Money Flow Calculation: The Money Flow Tracker calculates the Money Flow Index (MFI) based on price and volume data, factoring in buying pressure and selling pressure. The output is smoothed using a low-lag EMA to reduce noise and enhance usability.
Visual Features:
Dynamic Gradient Fill:
The space between the smoothed MFI line and the midline (set at 50) is filled with a gradient.
Above 50: Green gradient, with intensity increasing as the MFI moves further above the midline.
Below 50: Red gradient, with intensity increasing as the MFI moves further below the midline.
This gradient provides a clear visual representation of money flow strength and direction, making it easier to assess sentiment shifts at a glance.
Overbought/Oversold Levels: Default thresholds are set at 70 (overbought) and 30 (oversold). When the MFI crosses these levels, it signals potential reversals or trend continuations.
Bar Coloring:
Bars turn green for positive money flow and red for negative money flow.
Color intensity fades over time, ensuring recent signals stand out while older ones remain visible without dominating the chart.
Alerts:
Alerts are triggered when the Money Flow Tracker crosses into overbought or oversold zones, keeping traders informed of critical conditions without constant monitoring.
Practical Applications:
Trend Confirmation: Use the Money Flow Tracker alongside the oscillator or HMA to confirm trends or identify potential reversals.
Volume-Based Reversal Signals: Spot turning points where price action aligns with shifts in money flow direction.
Sentiment Analysis: Gauge whether market participants are accumulating (positive flow) or distributing (negative flow) assets, offering an additional layer of insight into price movement.
(Space for an example chart: “Money Flow Tracker with gradient fills and overbought/oversold levels”)
### 8. Putting It All Together
- Combining Signals: A practical approach might be to watch for a bullish divergence in the oscillator, confirm it with a shift in the HMA slope color, and then wait for the price to be near or below oversold conditions. The correlation histogram may further confirm if the broader market is also leaning bullish at that time.
- Visual Cues: Bar coloring adds another layer, making your chart easier to interpret at a glance. You can also set alerts to ensure you don’t miss key events like divergences, crossovers, or moving average flips.
- Flexibility: Not every feature needs to be used simultaneously. You might opt to focus on divergences and overbought/oversold signals, or you could emphasize the correlation histogram and bar colors. The settings let you enable or disable each module to suit your style.
---
### 9. Tips for Customization
- Adjust Periods: Shorter periods can yield more signals but also more noise. Longer periods may provide steadier, but fewer, signals.
- Set Appropriate Alert Conditions: Only alert on events most relevant to your strategy to avoid overload.
- Explore Different MAs: Depending on the instrument, some moving average types may give a smoother or more responsive indication.
- Monitor Risk Management: As with any tool, these signals do not guarantee performance, so consider position sizing and stop-loss strategies.
---
By toggling and experimenting with the features described above—buy/sell signals, divergences, moving averages, dynamic gradient clouds, and correlation analysis—you can tailor Uptrick: Oscillator Spectrum to your specific trading approach. Each module is designed to give you a clearer, structured view of potential momentum shifts, overbought or oversold states, and the alignment or divergence of multiple assets.
## Features Explanation
Below is a detailed overview of key features in Uptrick: Oscillator Spectrum. Each component is designed to provide different angles of market analysis, allowing you to customize the tool to your preferences.
---
### 1. Main Oscillator
- Purpose: The primary oscillator in this script merges short-, medium-, and long-term views of buying pressure and true range into a single line.
- Calculation: It weights each period’s contribution (e.g., a heavier focus on the short period if desired) and normalizes the result on a 0–100 scale, where higher readings may suggest more robust momentum. (like from the classic Ultimate Oscillator)
- Practical Use:
- Traders can watch for overbought/oversold conditions at user-defined thresholds (e.g., 70/30).
- It can also provide a straightforward momentum reading for those who prefer to see if momentum is rising, falling, or leveling off.
---
### 2. HMA of the Smoothed Oscillator
- What It Is: A Hull Moving Average (HMA) applied to the main oscillator values. The HMA is often more responsive than standard MAs, offering smoother lines while preserving relatively quick reaction to changes.
- How It Works:
- The script takes the oscillator’s output and processes it through a Hull MA calculation.
- The HMA’s slope and color can change more dynamically, highlighting sharper momentum shifts.
- Why It’s Useful:
- By smoothing out minor fluctuations, the HMA can highlight trends in the oscillator’s trajectory.
- If you see an extended run in the HMA slope, it may indicate a more persistent trend in momentum.
- Color Intensity:
- As the HMA continues in one direction for several bars, the script can intensify the color, signaling stronger or more sustained momentum in that direction.
- Sudden changes in color or slope can signal the start of a new momentum swing.
---
### 3. Gradient Fill
This script uses two gradient-based visual elements:
1. Shining/Layered Gradient on the Main Oscillator
- Purpose: Adds multiple layers around the oscillator line (above and below) to emphasize slope changes and highlight how quickly the oscillator is moving up or down.
- Color Changes:
- When the oscillator rises, it uses a color scheme (e.g., aqua/blue) that intensifies as the slope grows.
- When the oscillator declines, it uses a distinct color (e.g., red/pink).
- User Benefit: Makes it easier to see at a glance if momentum is accelerating or decelerating, beyond just the numerical reading.
2. Dynamic Cloud Fill (Between MAs)
- Purpose: Allows you to plot two moving averages (for example, a short-term Hull MA and a longer-term DEMA) and fill the area between them with a color gradient.
- Bullish vs. Bearish:
- When the short MA is above the long MA, the cloud might appear in a greenish hue.
- When the short MA is below the long MA, the cloud can switch to red or another color.
- Transparency/Intensity:
- The fill can get more opaque if the difference between the two MAs is large, indicating a stronger trend but a higher probability of a reversal.
- User Benefit: Helps visualize changes in trend or momentum across multiple time horizons, all within a single chart overlay.
---
### 4. Correlation Meter & Symbol Inputs
- What It Is: This feature looks at multiple user-selected symbols (e.g., BTC, ETH, BNB, etc.) and computes each symbol’s short-term slope. It then aggregates these slopes into an overall “trend” score.
- Inputs Configuration:
1. Ticker Inputs: You can specify up to five different tickers.
2. Timeframe: Decide whether to pull data from different chart timeframes for each symbol.
3. Slope Calculation: The script may compute, for instance, a 5-period SMA minus a 20-period SMA to gauge if each symbol is trending up or down.
- Market Trend Histogram:
- Displays a column that goes above/below zero depending on how many symbols are bullish or bearish.
- If more than three (out of five) symbols are bullish, the histogram can show a green bar at +1; if fewer than three are bullish, it can show red at –1.
- How to Use:
- Quick Glance: Lets you know if most correlated assets are aligning or diverging.
- Bar Coloring (Optional): If enabled, your main chart’s bars can reflect the aggregated correlation, turning green or red depending on the meter’s reading.
---
### 5. Advanced Metrics Table
- What It Is: An optional table displaying additional metrics for several cryptocurrencies (or any symbols you define).
- Metrics Included:
1. ROI (30D): Calculates return relative to the lowest price in a 30-day period.
2. Collateral Risk: Uses standard deviation to assess volatility (higher risk if standard deviation is large).
3. Liquidity Recovery: A rolling average of volume, aiming to show how liquidity flows might recover over time.
4. Weakening (Rate of Change): Reflects how quickly price is changing compared to previous bars.
5. Monetary Bias (SMA): A simple average of recent prices. If price is below this SMA, it might be seen as undervalued relative to the short term.
6. Risk Phase: Categorizes risk as low, medium, or high based on the standard deviation figure.
7. DCA Signal: Suggests “Accumulate” or “Do Not Accumulate” by checking if the current price is below or above the SMA.
- Why It’s Useful:
- Offers a concise view of multiple assets in one place—helpful for portfolio-level insight.
- DCA (Dollar-Cost Averaging) suggestions can guide longer-term strategies, while volatility (collateral risk) helps gauge how aggressive the price swings might be.
---
### 6. Other Vital Aspects
- Alerts & Notifications:
- The script can trigger alerts for various conditions—crossovers, divergence detections, overbought/oversold transitions, or correlation-based signals.
- Useful for automating watchlists or ensuring you don’t miss a key setup while away from the screen.
- Customization:
- Each module (oscillator settings, divergence detection, correlation meter, advanced metrics table, etc.) can be enabled or disabled based on your preferences.
- You can fine-tune parameters (e.g., periods, smoothing lengths, alert triggers) to align the indicator with different trading styles—scalping, swing, or position trading.
- Combining Features:
- One might watch the main oscillator for momentum extremes, confirm via the HMA slope, check if correlation supports the same bias, and look at the table for risk-phase validation.
- This multi-layer approach can help develop a more structured and informed trading view.
(Space for an example chart: “A fully configured layout showing oscillator, HMA, gradient cloud, correlation meter, and table all in use.”)
7. Money Flow Tracker
Purpose: The Money Flow Tracker adds a volume-based perspective to the indicator suite by incorporating the Money Flow Index (MFI), which assesses buying and selling pressure over a defined period. By smoothing the MFI using an exponential moving average (EMA), the feature highlights the directional flow of capital into and out of the market with greater clarity and reduced noise.
Dynamic Gradient Visualization:
The Money Flow Tracker enhances visual analysis with gradient fills that reflect the MFI’s relationship to the midline (50).
Above 50: A green gradient emerges, intensifying as the MFI moves higher, indicating stronger positive money flow.
Below 50: A red gradient appears, with deeper shades signifying increasing selling pressure.
Transparency dynamically adjusts based on the MFI’s proximity to the midline, making high-confidence zones (closer to 0 or 100) visually distinct.
Directional Sensitivity:
The Tracker emphasizes the importance of overbought (above 70) and oversold (below 30) zones. These thresholds help traders identify when an asset might be overextended, signaling potential reversals or trend continuations.
The inclusion of a midline (50) as a neutral zone helps gauge shifts between accumulation (money flowing in) and distribution (money flowing out).
Bar Integration:
By enabling bar coloring linked to the Money Flow Tracker, traders can visualize its impact directly on price bars.
Green bars reflect positive money flow (above 50), signaling bullish conditions.
Red bars indicate negative money flow (below 50), highlighting bearish sentiment.
Intensity adjustments ensure that recent signals are more visually prominent, while older signals gradually fade for a clean, non-cluttered chart.
Key Advantages:
Volume-Informed Context: Traditional oscillators often focus solely on price; the Money Flow Tracker incorporates volume, adding a crucial dimension for analyzing market behavior.
Adaptive Filtering: The EMA-smoothing feature ensures that sudden, insignificant spikes in volume don’t trigger false signals, providing a clearer and more actionable representation of money flow trends.
Early Warning System: Divergences between price movement and the Money Flow Tracker’s trends can signal potential turning points, helping traders anticipate reversals before they occur.
Practical Use Cases:
Trend Confirmation: Pair the Money Flow Tracker with the oscillator or HMA to confirm bullish or bearish trends. For example, a rising oscillator with positive money flow indicates strong buying interest.
Identifying Entry/Exit Zones: Use overbought/oversold conditions as entry/exit points, particularly when combined with other features like divergence detection.
Market Sentiment Analysis: The Tracker’s ability to dynamically assess buying and selling pressure provides a clear picture of market sentiment, helping traders adjust their strategies to align with broader trends.
By understanding these features—main oscillator readings, the HMA’s smoothing capabilities, gradient-based visual highlights, correlation insights, advanced metrics, and the money flow tracker—you can tailor Uptrick: Oscillator Spectrum to your specific needs, whether you’re focusing on quick trades, longer-term market moves, or broad portfolio health.
Originality of the “Uptrick: Oscillator Spectrum” Indicator
While it includes elements of standard momentum analysis, Uptrick: Oscillator Spectrum sets itself apart by adding an array of features that broaden the typical oscillator’s scope:
1. Slope Coloring & Layered Gradient Effects
- Beyond just plotting a single line, the indicator visually highlights momentum shifts using color changes and gradient fills.
- As the oscillator’s slope becomes steeper or flatter, these gradients intensify or fade, helping users see at a glance when momentum is accelerating, slowing, or reversing.
2. Mean Reversion & Divergence Detection
- The script offers optional logic for marking potential mean reversion points (e.g., overbought/oversold crossovers) and flagging divergences between price and the oscillator line.
- These divergence signals come with adjustable lookback parameters, giving traders control over how recent or extended the pivots should be for detection.
- This functionality can reveal subtle momentum discrepancies that a basic oscillator might overlook.
3. Integrated Multi-Asset Correlation Meter
- In addition to monitoring a single symbol, the indicator can fetch data for multiple tickers. It aggregates each symbol’s slope into a histogram showing whether the broader market (or a group of assets) leans bullish or bearish.
- This cross-market insight moves beyond standard “one-symbol, one-oscillator” usage, adding a bigger-picture perspective in one tool.
4. Advanced Metrics Table
- Users can enable a table that covers ROI calculations, volatility-based risk (“Collateral Risk”), liquidity checks, DCA signals, and more.
- Rather than just seeing an oscillator value, traders can view additional metrics for selected assets in one place, helping them judge overall market conditions or assess multiple instruments simultaneously.
5. Flexible Overlay & Bar Coloring
- Signals can be displayed directly on the price chart (Overlay True) or in a sub-window (Overlay False).
- Bars themselves may change color (e.g., green for bullish or red for bearish) according to different rules—signals, dynamic cloud fill, correlation meter states, etc.
- This adaptability allows traders to keep the chart as simple or as info-rich as they prefer.
6. Custom Smoothing Options & HMA Extensions
- The oscillator can be processed further with a Hull Moving Average (HMA) to reduce noise while still reacting quickly to market changes.
- Slope-based coloring on the HMA provides an additional layer of visual feedback, which is not common in a standard oscillator.
By blending traditional momentum checks with slope-based color feedback, mean reversion triggers, divergence signals, correlation analysis, and an optional metrics table, Uptrick: Oscillator Spectrum offers a more rounded approach than a typical oscillator. It integrates multiple market insights—both visual and analytical—into one script, giving users a broader toolkit for studying potential reversals, gauging momentum strength, and assessing multi-asset trends.
## Conclusion
Uptrick: Oscillator Spectrum brings together multiple layers of analysis—oscillator momentum, divergence detection, correlation insights, HMA smoothing, and more—into one adaptable toolkit. It aims to streamline your charting process by offering meaningful visual cues (such as gradient fills and bar color shifts), advanced tables for broader market data, and flexible alerts to keep you informed of potential setups.
Traders can choose the specific features that suit their style, whether they prefer to focus on raw oscillator signals, multi-ticker correlation, or smooth trend cues from the HMA. By centralizing these different methods in one place, Uptrick: Oscillator Spectrum can help users build more structured approaches to spotting trend shifts and extended conditions, while also remaining compatible with additional analysis techniques.
---
### Disclaimer
This script is provided for informational purposes only and does not constitute financial or investment advice. Past performance is not indicative of future results, and all trading involves risk. You should carefully consider your objectives, risk tolerance, and financial situation before making any trading decisions.

Watermark with dynamic variables [BM]█ OVERVIEW
This indicator allows users to add highly customizable watermark messages to their charts. Perfect for branding, annotation, or displaying dynamic chart information, this script offers advanced customization options including dynamic variables, text formatting, and flexible positioning.
█ CONCEPTS
Watermarks are overlay messages on charts. This script introduces placeholders — special keywords wrapped in % signs — that dynamically replace themselves with chart-related data. These watermarks can enhance charts with context, timestamps, or branding.
█ FEATURES
Dynamic Variables : Replace placeholders with real-time data such as bar index, timestamps, and more.
Advanced Customization : Modify text size, color, background, and alignment.
Multiple Messages : Add up to four independent messages per group, with two groups supported (A and B).
Positioning Options : Place watermarks anywhere on the chart using predefined locations.
Timezone Support : Display timestamps in a preferred timezone with customizable formats.
█ INPUTS
The script offers comprehensive input options for customization. Each Watermark (A and B) contains identical inputs for configuration.
Watermark settings are divided into two levels:
Watermark-Level Settings
These settings apply to the entire watermark group (A/B):
Show Watermark: Toggle the visibility of the watermark group on the chart.
Position: Choose where the watermark group is displayed on the chart.
Reverse Line Order: Enable to reverse the order of the lines displayed in Watermark A.
Message-Level Settings
Each watermark contains up to four configurable messages. These messages can be independently customized with the following options:
Message Content: Enter the custom text to be displayed. You can include placeholders for dynamic data.
Text Size: Select from predefined sizes (Tiny, Small, Normal, Large, Huge) or specify a custom size.
Text Alignment and Colors:
- Adjust the alignment of the text (Left, Center, Right).
- Set text and background colors for better visibility.
Format Time: Enable time formatting for this watermark message and configure the format and timezone. The settings for each message include message content, text size, alignment, and more. Please refer to Formatting dates and times for more details on valid formatting tokens.
█ PLACEHOLDERS
Placeholders are special keywords surrounded by % signs, which the script dynamically replaces with specific chart-related data. These placeholders allow users to insert dynamic content, such as bar information or timestamps, into watermark messages.
Below is the complete list of currently available placeholders:
bar_index , barstate.isconfirmed , barstate.isfirst , barstate.ishistory , barstate.islast , barstate.islastconfirmedhistory , barstate.isnew , barstate.isrealtime , chart.is_heikinashi , chart.is_kagi , chart.is_linebreak , chart.is_pnf , chart.is_range , chart.is_renko , chart.is_standard , chart.left_visible_bar_time , chart.right_visible_bar_time , close , dayofmonth , dayofweek , dividends.future_amount , dividends.future_ex_date , dividends.future_pay_date , earnings.future_eps , earnings.future_period_end_time , earnings.future_revenue , earnings.future_time , high , hl2 , hlc3 , hlcc4 , hour , last_bar_index , last_bar_time , low , minute , month , ohlc4 , open , second , session.isfirstbar , session.isfirstbar_regular , session.islastbar , session.islastbar_regular , session.ismarket , session.ispostmarket , session.ispremarket , syminfo.basecurrency , syminfo.country , syminfo.currency , syminfo.description , syminfo.employees , syminfo.expiration_date , syminfo.industry , syminfo.main_tickerid , syminfo.mincontract , syminfo.minmove , syminfo.mintick , syminfo.pointvalue , syminfo.prefix , syminfo.pricescale , syminfo.recommendations_buy , syminfo.recommendations_buy_strong , syminfo.recommendations_date , syminfo.recommendations_hold , syminfo.recommendations_sell , syminfo.recommendations_sell_strong , syminfo.recommendations_total , syminfo.root , syminfo.sector , syminfo.session , syminfo.shareholders , syminfo.shares_outstanding_float , syminfo.shares_outstanding_total , syminfo.target_price_average , syminfo.target_price_date , syminfo.target_price_estimates , syminfo.target_price_high , syminfo.target_price_low , syminfo.target_price_median , syminfo.ticker , syminfo.tickerid , syminfo.timezone , syminfo.type , syminfo.volumetype , ta.accdist , ta.iii , ta.nvi , ta.obv , ta.pvi , ta.pvt , ta.tr , ta.vwap , ta.wad , ta.wvad , time , time_close , time_tradingday , timeframe.isdaily , timeframe.isdwm , timeframe.isintraday , timeframe.isminutes , timeframe.ismonthly , timeframe.isseconds , timeframe.isticks , timeframe.isweekly , timeframe.main_period , timeframe.multiplier , timeframe.period , timenow , volume , weekofyear , year
█ HOW TO USE
1 — Add the Script:
Apply "Watermark with dynamic variables " to your chart from the TradingView platform.
2 — Configure Inputs:
Open the script settings by clicking the gear icon next to the script's name.
Customize visibility, message content, and appearance for Watermark A and Watermark B.
3 — Utilize Placeholders:
Add placeholders like %bar_index% or %timenow% in the "Watermark - Message" fields to display dynamic data.
Empty lines in the message box are reflected on the chart, allowing you to shift text up or down.
Using \n in the message box translates to a new line on the chart.
4 — Preview Changes:
Adjust settings and view updates in real-time on your chart.
█ EXAMPLES
Branding
DodgyDD's charts
Debugging
█ LIMITATIONS
Only supports variables defined within the script.
Limited to four messages per watermark.
Visual alignment may vary across different chart resolutions or zoom levels.
Placeholder parsing relies on correct input formatting.
█ NOTES
This script is designed for users seeking enhanced chart annotation capabilities. It provides tools for dynamic, customizable watermarks but is not a replacement for chart objects like text labels or drawings. Please ensure placeholders are properly formatted for correct parsing.
Additionally, this script can be a valuable tool for Pine Script developers during debugging . By utilizing dynamic placeholders, developers can display real-time values of variables and chart data directly on their charts, enabling easier troubleshooting and code validation.
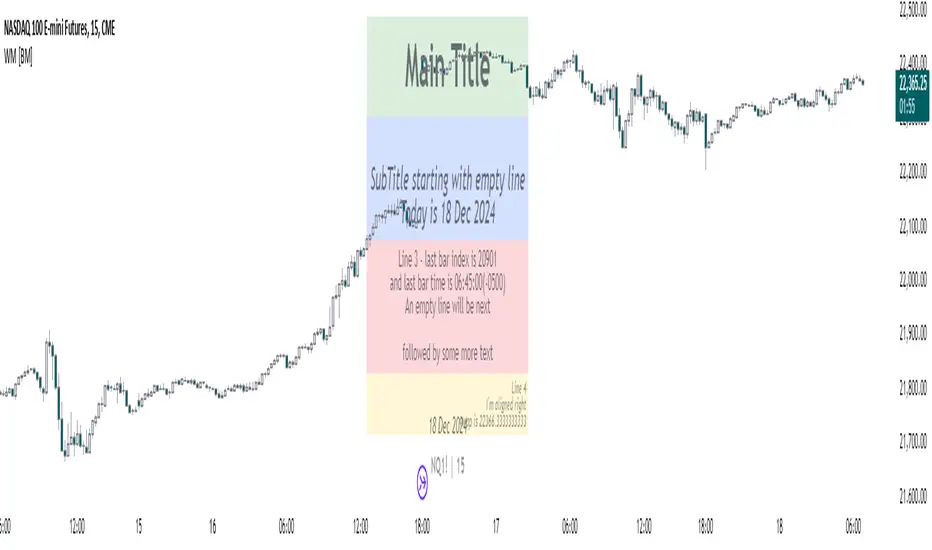
DNSE VN301!, SMA & EMA Cross StrategyDiscover the tailored Pinescript to trade VN30F1M Future Contracts intraday, the strategy focuses on SMA & EMA crosses to identify potential entry/exit points. The script closes all positions by 14:25 to avoid holding any contracts overnight.
HNX:VN301!
www.tradingview.com
Setting & Backtest result:
1-minute chart, initial capital of VND 100 million, entering 4 contracts per time, backtest result from Jan-2024 to Nov-2024 yielded a return over 40%, executed over 1,000 trades (average of 4 trades/day), winning trades rate ~ 30% with a profit factor of 1.10.
The default setting of the script:
A decent optimization is reached when SMA and EMA periods are set to 60 and 15 respectively while the Long/Short stop-loss level is set to 20 ticks (2 points) from the entry price.
Entry & Exit conditions:
Long signals are generated when ema(15) crosses over sma(60) while Short signals happen when ema(15) crosses under sma(60). Long orders are closed when ema(15) crosses under sma(60) while Short orders are closed when ema(15) crosses over sma(60).
Exit conditions happen when (whichever came first):
Another Long/Short signal is generated
The Stop-loss level is reached
The Cut-off time is reached (14:25 every day)
*Disclaimers:
Futures Contracts Trading are subjected to a high degree of risk and price movements can fluctuate significantly. This script functions as a reference source and should be used after users have clearly understood how futures trading works, accessed their risk tolerance level, and are knowledgeable of the functioning logic behind the script.
Users are solely responsible for their investment decisions, and DNSE is not responsible for any potential losses from applying such a strategy to real-life trading activities. Past performance is not indicative/guarantee of future results, kindly reach out to us should you have specific questions about this script.
---------------------------------------------------------------------------------------
Khám phá Pinescript được thiết kế riêng để giao dịch Hợp đồng tương lai VN30F1M trong ngày, chiến lược tập trung vào các đường SMA & EMA cắt nhau để xác định các điểm vào/ra tiềm năng. Chiến lược sẽ đóng tất cả các vị thế trước 14:25 để tránh giữ bất kỳ hợp đồng nào qua đêm.
Thiết lập & Kết quả backtest:
Chart 1 phút, vốn ban đầu là 100 triệu đồng, vào 4 hợp đồng mỗi lần, kết quả backtest từ tháng 1/2024 tới tháng 11/2024 mang lại lợi nhuận trên 40%, thực hiện hơn 1.000 giao dịch (trung bình 4 giao dịch/ngày), tỷ lệ giao dịch thắng ~ 30% với hệ số lợi nhuận là 1,10.
Thiết lập mặc định của chiến lược:
Đạt được một mức tối ưu ổn khi SMA và EMA periods được đặt lần lượt là 60 và 15 trong khi mức cắt lỗ được đặt thành 20 tick (2 điểm) từ giá vào.
Điều kiện Mở và Đóng vị thế:
Tín hiệu Long được tạo ra khi ema(15) cắt trên sma(60) trong khi tín hiệu Short xảy ra khi ema(15) cắt dưới sma(60). Lệnh Long được đóng khi ema(15) cắt dưới sma(60) trong khi lệnh Short được đóng khi ema(15) cắt lên sma(60).
Điều kiện đóng vị thể xảy ra khi (tùy điều kiện nào đến trước):
Một tín hiệu Long/Short khác được tạo ra
Giá chạm mức cắt lỗ
Lệnh chưa đóng nhưng tới giờ cut-off (14:25 hàng ngày)
*Tuyên bố miễn trừ trách nhiệm:
Giao dịch hợp đồng tương lai có mức rủi ro cao và giá có thể dao động đáng kể. Chiến lược này hoạt động như một nguồn tham khảo và nên được sử dụng sau khi người dùng đã hiểu rõ cách thức giao dịch hợp đồng tương lai, đã đánh giá mức độ chấp nhận rủi ro của bản thân và hiểu rõ về logic vận hành của chiến lược này.
Người dùng hoàn toàn chịu trách nhiệm về các quyết định đầu tư của mình và DNSE không chịu trách nhiệm về bất kỳ khoản lỗ tiềm ẩn nào khi áp dụng chiến lược này vào các hoạt động giao dịch thực tế. Hiệu suất trong quá khứ không chỉ ra/cam kết kết quả trong tương lai, vui lòng liên hệ với chúng tôi nếu bạn có thắc mắc cụ thể về chiến lược giao dịch này.

CCOMET_Scanner_LibraryLibrary "CCOMET_Scanner_Library"
- A Trader's Edge (ATE)_Library was created to assist in constructing CCOMET Scanners
Loc_tIDs_Col(_string, _firstLocation)
TickerIDs: You must form this single tickerID input string exactly as described in the scripts info panel (little gray 'i' that
is circled at the end of the settings in the settings/input panel that you can hover your cursor over this 'i' to read the
details of that particular input). IF the string is formed correctly then it will break up this single string parameter into
a total of 40 separate strings which will be all of the tickerIDs that the script is using in your CCOMET Scanner.
Locations: This function is used when there's a desire to print an assets ALERT LABELS. A set Location on the scale is assigned to each asset.
This is created so that if a lot of alerts are triggered, they will stay relatively visible and not overlap each other.
If you set your '_firstLocation' parameter as 1, since there are a max of 40 assets that can be scanned, the 1st asset's location
is assigned the value in the '_firstLocation' parameter, the 2nd asset's location is the (1st asset's location+1)...and so on.
Parameters:
_string (simple string) : (string)
A maximum of 40 Tickers (ALL joined as 1 string for the input parameter) that is formulated EXACTLY as described
within the tooltips of the TickerID inputs in my CCOMET Scanner scripts:
assets = input.text_area(tIDset1, title="TickerID (MUST READ TOOLTIP)", tooltip="Accepts 40 TICKERID's for each
copy of the script on the chart. TEXT FORMATTING RULES FOR TICKERID'S:
(1) To exclude the EXCHANGE NAME in the Labels, de-select the next input option.
(2) MUST have a space (' ') AFTER each TickerID.
(3) Capitalization in the Labels will match cap of these TickerID's.
(4) If your asset has a BaseCurrency & QuoteCurrency (ie. ADAUSDT ) BUT you ONLY want Labels
to show BaseCurrency(ie.'ADA'), include a FORWARD SLASH ('/') between the Base & Quote (ie.'ADA/USDT')", display=display.none)
_firstLocation (simple int) : (simple int)
Optional (starts at 1 if no parameter added).
Location that you want the first asset to print its label if is triggered to do so.
ie. loc2=loc1+1, loc3=loc2+1, etc.
Returns: Returns 40 output variables in the tuple (ie. between the ' ') with the TickerIDs, 40 variables for the locations for alert labels, and 40 Colors for labels/plots
TickeridForLabelsAndSecurity(_ticker, _includeExchange)
This function accepts the TickerID Name as its parameter and produces a single string that will be used in all of your labels.
Parameters:
_ticker (simple string) : (string)
For this parameter, input the varible named '_coin' from your 'f_main()' function for this parameter. It is the raw
Ticker ID name that will be processed.
_includeExchange (simple bool) : (bool)
Optional (if parameter not included in function it defaults to false ).
Used to determine if the Exchange name will be included in all labels/triggers/alerts.
Returns: ( )
Returns 2 output variables:
1st ('_securityTickerid') is to be used in the 'request.security()' function as this string will contain everything
TV needs to pull the correct assets data.
2nd ('lblTicker') is to be used in all of the labels in your CCOMET Scanner as it will only contain what you want your labels
to show as determined by how the tickerID is formulated in the CCOMET Scanner's input.
InvalID_LblSz(_barCnt, _close, _securityTickerid, _invalidArray, _tablePosition, _stackVertical, _lblSzRfrnce)
INVALID TICKERIDs: This is to add a table in the middle right of your chart that prints all the TickerID's that were either not formulated
correctly in the '_source' input or that is not a valid symbol and should be changed.
LABEL SIZES: This function sizes your Alert Trigger Labels according to the amount of Printed Bars the chart has printed within
a set time period, while also keeping in mind the smallest relative reference size you input in the 'lblSzRfrnceInput'
parameter of this function. A HIGHER % of Printed Bars(aka...more trades occurring for that asset on the exchange),
the LARGER the Name Label will print, potentially showing you the better opportunities on the exchange to avoid
exchange manipulation liquidations.
*** SHOULD NOT be used as size of labels that are your asset Name Labels next to each asset's Line Plot...
if your CCOMET Scanner includes these as you want these to be the same size for every asset so the larger ones dont cover the
smaller ones if the plots are all close to each other ***
Parameters:
_barCnt (float) : (float)
Get the 1st variable('barCnt') from the Security function's tuple and input it as this functions 1st input
parameter which will directly affect the size of the 2nd output variable ('alertTrigLabel') that is also outputted by this function.
_close (float) : (float)
Put your 'close' variable named '_close' from the security function here.
_securityTickerid (string) : (string)
Throughout the entire charts updates, if a '_close' value is never registered then the logic counts the asset as INVALID.
This will be the 1st TickerID variable (named _securityTickerid) outputted from the tuple of the TickeridForLabels()
function above this one.
_invalidArray (array) : (array string)
Input the array from the original script that houses all of the invalidArray strings.
_tablePosition (simple string) : (string)
Optional (if parameter not included, it defaults to position.middle_right). Location on the chart you want the table printed.
Possible strings include: position.top_center, position.top_left, position.top_right, position.middle_center,
position.middle_left, position.middle_right, position.bottom_center, position.bottom_left, position.bottom_right.
_stackVertical (simple bool) : (bool)
Optional (if parameter not included, it defaults to true). All of the assets that are counted as INVALID will be
created in a list. If you want this list to be prited as a column then input 'true' here, otherwise they will all be in a row.
_lblSzRfrnce (string) : (string)
Optional (if parameter not included, it defaults to size.small). This will be the size of the variable outputted
by this function named 'assetNameLabel' BUT also affects the size of the output variable 'alertTrigLabel' as it uses this parameter's size
as the smallest size for 'alertTrigLabel' then uses the '_barCnt' parameter to determine the next sizes up depending on the "_barCnt" value.
Returns: ( )
Returns 2 variables:
1st output variable ('AssetNameLabel') is assigned to the size of the 'lblSzRfrnceInput' parameter.
2nd output variable('alertTrigLabel') can be of variying sizes depending on the 'barCnt' parameter...BUT the smallest
size possible for the 2nd output variable ('alertTrigLabel') will be the size set in the 'lblSzRfrnceInput' parameter.
PrintedBarCount(_time, _barCntLength, _barCntPercentMin)
The Printed BarCount Filter looks back a User Defined amount of minutes and calculates the % of bars that have printed
out of the TOTAL amount of bars that COULD HAVE been printed within the same amount of time.
Parameters:
_time (int) : (int)
The time associated with the chart of the particular asset that is being screened at that point.
_barCntLength (int) : (int)
The amount of time (IN MINUTES) that you want the logic to look back at to calculate the % of bars that have actually
printed in the span of time you input into this parameter.
_barCntPercentMin (int) : (int)
The minimum % of Printed Bars of the asset being screened has to be GREATER than the value set in this parameter
for the output variable 'bc_gtg' to be true.
Returns: ( )
Returns 2 outputs:
1st is the % of Printed Bars that have printed within the within the span of time you input in the '_barCntLength' parameter.
2nd is true/false according to if the Printed BarCount % is above the threshold that you input into the '_barCntPercentMin' parameter.

MoonFlag BTC Daily Swing PredictorThis script mainly works on BTC on the daily timeframe. Other coins also show similar usefulness with this script however, BTC on the daily timeframe is the main design for this script.
(Please note this is not trading advice this is just comments about how this indicator works.)
This script is predictive. It colors the background yellow when the script calculates a large BTC swing is potentially about to happen. It does not predict in which direction the swing will occur but it leads the price action so can be useful for leveraged trades. When the background gets colored with vertical yellow lines - this shows that a largish price swing is probably going to occur.
The scripts also shades bands around the price action that are used to estimate an acceptable volatility at any given time. If the bands are wide that means price action is volatile and large swings are not easily predicted. Over time, with reducing volatility, these price action bands narrow and then at a set point or percentage (%) which can be set in the script settings, the background gets colored yellow. This indicates present price action is not volatile and a large price swing is potentially going to happen in the near future. When price action breaks through the narrowing bands, the background is no longer presented because this is seen as an increase in volatility and a considerable portion of the time, a large sudden drop in price action or momentous gain in price is realized.
This indicator leads price action. It predicts that a swing is possibly going to happen in the near future. As the indicator works on the BTC daily, this means on a day-to-day basis if the bands continually narrow - a breakout is more likely to happen. In order to see how well this indicator works, have a look at the results on the screenshot provided. Note the regions where vertical yellow lines are present on the price action - and then look after these to see if a sizeable swing in price has occurred.
To use this indicator - wait until yellow vertical lines are presented on the BTC daily. Then use your experience to determine which way the price action might swing and consider entering a trade or leveraged trade in this direction. Alternatively wait a while to see in which direction the break-out occurs and considering and attempt to trade with this. Sometimes swings can be unexpected and breakout in one direction before then swinging much larger in the other. Its important to remember/consider that this indicator works on the BTC daily timeframe, so any consideration of entering a trade should be expected to cover a duration over many days or weeks, or possibly months. A large swing is only estimated every several plus months.
Most indicators are based on moving averages. A moving average is not predictive in the sense in that it lags price actions. This indicator creates bands that are based on the momentum of the price action. A change in momentum of price action therefore causes the bands to widen. When the bands narrow this means that the momentum of the price action is steady and price action volatility has converged/reduced over time. With BTC this generally means that a large swing in price action is going to occur as momentum in price action then pick-up again in one direction or another. Trying to view this using moving averages is not easy as a moving average lags price action which means that it is difficult to predict any sudden movements in price action ahead of when they might occur. Although, moving averages will converge over time in a similar manner as the bands calculated by this script. This script however, uses the price action momentum in a predictive manner to estimate where the price action might go based on present price momentum. This script therefore reacts to reduced volatility in price action much faster than a set of moving averages over various timescales can achieve.
MoonFlag
